Pandora Raises $2.4M From Industry Heavyweights to Bridge off-Chain Assets to Open Finance via NFTs

PRESS RELEASE. Pandora Finance (https://pandora.finance/) announced that they have successfully closed their $2.4m seed round. The Pandora team received pledges from some of the most visible investors within the crypto space, and closed the round oversubscribed by manifolds.

Overview of strategic investors

The funding round concluded with Pandora selecting some of the most well respected investors within the crypto space. Pandora’s strategic investors include Genesis Block, Spark Digital Assets, AU21, x21, NGC, Zokyo Ventures, Exnetwork, A195, Protocol Ventures, Genblock, Magnus Capital, Chain Asset Capital, Amesten, Crypto Dorm Fund and Master Ventures and accredited individual investors like Danish Chaudhari (Bitcoin.com Exchange) and others.

“GBV has been following the NFT developments closely. In Pandora, we find a unique and innovative solution to bring liquidity to the NFT ecosystem. This represents a major breakthrough in the potential use cases for NFTs!”

— Leslie Tam, Genesis Block Ventures Co-Founder and Partner.

“We are excited to partner with Pandora as they create greater interoperability and liquidity for traditionally illiquid assets, and introduce new exposure opportunities onto the blockchain. Pandora’s clever integration of NFT technology, comprehensive suite of product offerings, and their stellar team position them favorably to succeed in their mission to bridge the divide between digital and physical assets.”

— AU21 (https://au21.capital/)

Overview

Pandora Protocol is a hybrid Open Finance solution for problems faced by both traditional finance, and decentralised finance. By creating a bridge between real-world and on-chain assets, this protocol allows for the tokenization of illiquid assets – meaning they can be found, traded and owned in a secure, decentralized way.

NFTs have been increasingly popular over the last 12 months; however, the lack of liquidity has been a growing concern for many. Pandora’s middleware solution induces liquidity in the NFT ecosystem for any NFT platform; this can come in the form of tokenized real-world assets, through to digital asset NFT’s. Pandora offers significant advantages over other marketplace enablement technologies because instead of competing with other NFT platforms for liquidity, they are helping other platforms grow just by inducing liquidity into them.

It is this technology which sits at the heart of Pandora protocol’s future value. Imagine being able to have a marketplace where both digitally native and real-world assets could find liquidity, accurate pricing while also continually being updated with relevant on-chain data. This would add significant utility and purpose to the NFT space, and allow them to be swapped, traded or borrowed.

What is coming up next for Pandora

Not content with opening up marketplace liquidity to real-world assets, Pandora is currently working on a unique new standard they are naming PiNFT. This hybrid standard, which has the functionality of both fungible and non-fungible tokens, works by wrapping NFTs around something with intrinsic value; such as DAI. This can then be traded on Uniswap, Maker and AAVE – effectively enabling NFT cross-chain trade on a huge number of platforms.

Looking ahead to the remainder of 2021, the Pandora team will be continuing to improve the product and establish even more partnerships to grow the protocol’s effective reach. In the meantime, the team behind Pandora is gearing up for their IDO (Initial DEX Offering).

“We at Pandora are envisioned with bridging the gap between on-chain and real-world assets via NFTs. Our team with driven forces is all geared up to revolutionise the NFT ecosystem by maximising its potential and bringing liquidity to the world of latent illiquid assets”.

– Pushkar Vohra, Founder & CEO – Pandora Finance


About Pandora

Pandora creates a bridge between on-chain and real-world assets to form an open finance ecosystem. This protocol allows for the tokenization of illiquid assets, meaning they can be found, traded, borrowed and owned in a secure, decentralized way. Pandora provides both a middleware solution for minting liquidity enabled NFTs, alongside offering Dapp developers the ability to leverage Pandora to provide liquidity to their own users’ NFTs.

Website: http://www.pandora.finance/

Twitter: https://twitter.com/PandoraProtocol

Medium: https://medium.com/pandoraprotocol

LinkedIn: https://linkedin.com/company/pandoraprotocol

Telegram Official Group: https://t.me/PandoraProtocol


This is a press release. Readers should do their own due diligence before taking any actions related to the promoted company or any of its affiliates or services. Bitcoin.com is not responsible, directly or indirectly, for any damage or loss caused or alleged to be caused by or in connection with the use of or reliance on any content, goods or services mentioned in the press release.

Go to Source

Spiral Out — Using the Golden Ratio and Fibonacci sequence to Predict Bitcoin Price Cycles

The leading crypto asset bitcoin has seen its value drop more than 53% from its all-time high above the $64k handle, sliding to a low of $30k on May 19. While bitcoin is still down 25% during the last 30 days, it’s hard to forecast where bitcoin’s value is going from here. Although a number of people leverage indicators like the Golden Ratio Multiplier, Fibonacci sequence, logarithmic growth curves, and tools such as the infamous stock-to-flow (S2F) price model to predict future bitcoin valuations.

Predicting Bitcoin’s Booms and Busts With the Number Phi

Most people can’t predict the future and when it comes to bitcoin (BTC) and the crypto economy, in general, as busts and booms are common. Moreover, lots of times busts and booms are unpredictable except for a few occasions like specific news stories that shake investors. However, there’s a plethora of technical analysis tools, charts, and models that help a great number of people get ahead of the game.

For instance, fans of technical analysis leverage the perspective of the golden ratio and Fibonacci sequence in order to predict future bitcoin valuations. Essentially a trader will apply mathematics to things like bitcoin’s value and moving averages. The golden ratio is also known as divine section, divine proportion, the number phi, extreme and mean ratio, and the golden number. Essentially in the “science of quantity,” two quantities reach a mathematical divine section when their ratio is equal to the ratio of their sum to the larger of the two quantities.

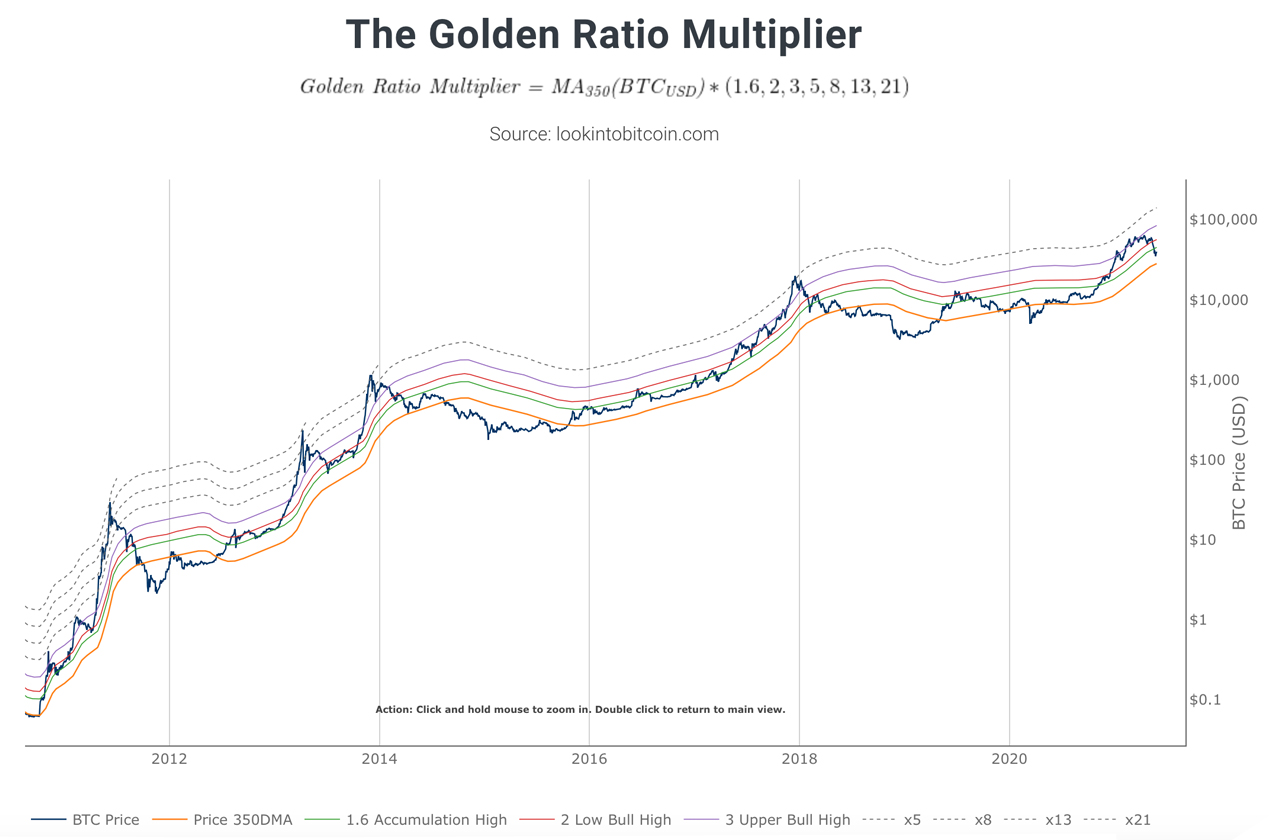
The golden ratio is equal to 1.618 and it’s not only used in mathematics, but it also appears in architecture, geometry, and many natural elements. Then there’s the classical example of mathematics called the Fibonacci sequence, which is a sequence of quantities where a number is the addition of the last two quantities, starting with 0, and 1. The Golden Ratio Multiplier hosted on lookintobitcoin.com gives a detailed description of how the multiplier works with the leading crypto asset bitcoin (BTC).

“Bitcoin’s adoption curve and market cycles to understand how price may behave on medium to long term time frames,” the website notes. “To do this it uses multiples of the 350 day moving average (350DMA) of Bitcoin’s price to identify areas of potential resistance to price movements.” Lookintobitcoin.com further adds:

Multiples are of the 350DMA’s price values rather than its number of days. The multiples reference the Golden Ratio (1.6) and the Fibonacci sequence (0, 1, 1, 2, 3, 5, 8, 13, 21). These are important mathematical numbers. These specific multiplications of the 350DMA have been very effective over time at picking out intracycle highs for Bitcoin price and also the major market cycle highs.

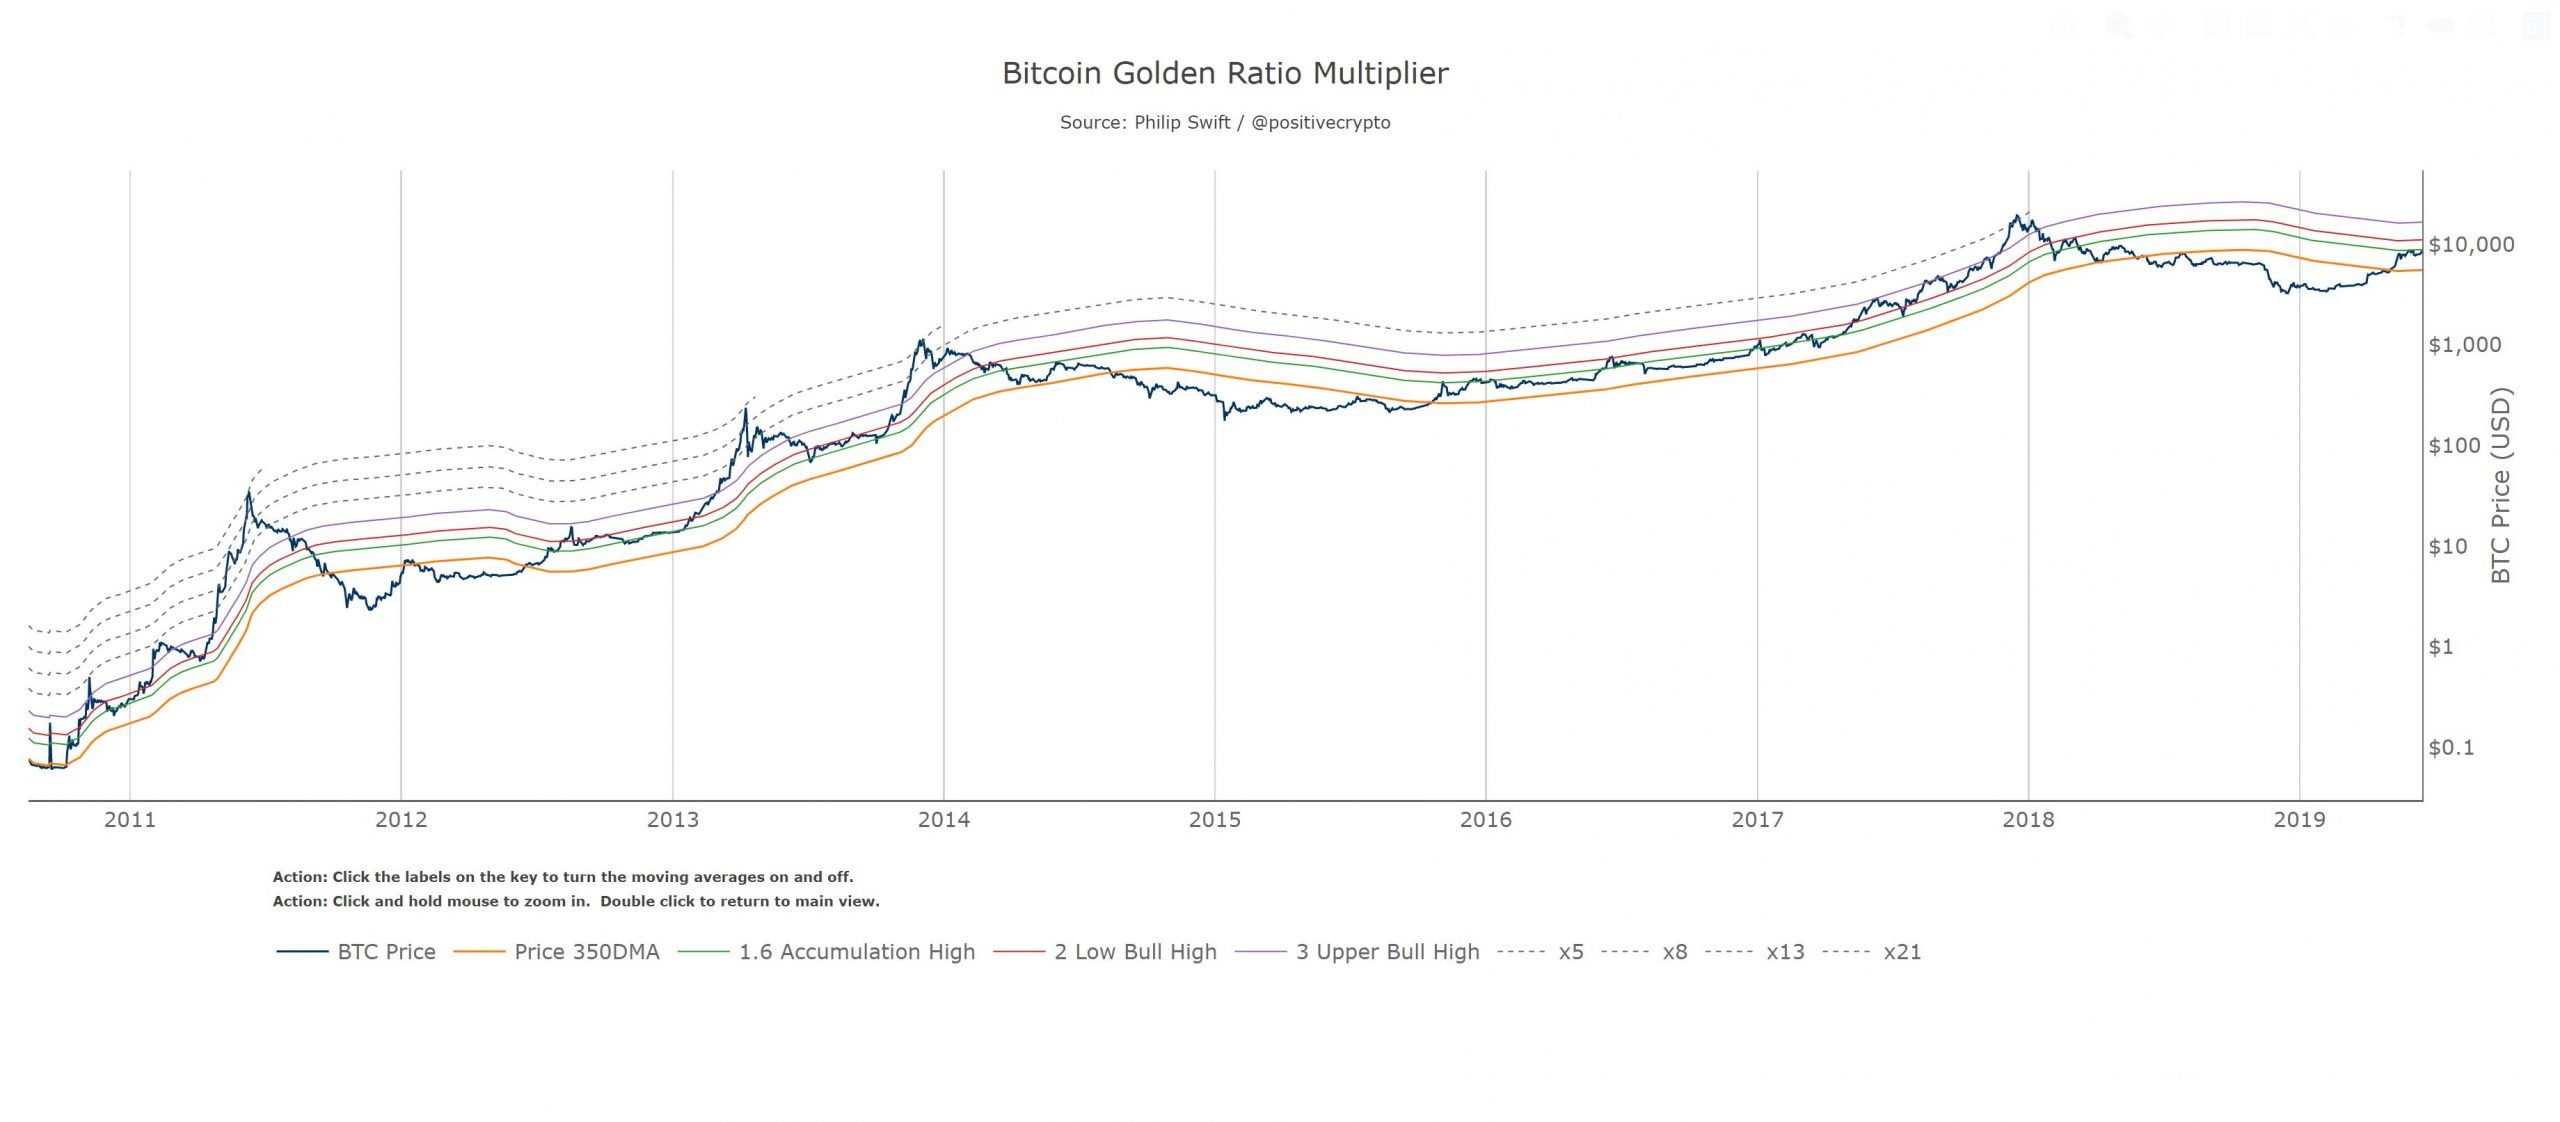
The Golden Ratio Multiplier, as it is applied to bitcoin price predictions, was invoked by Philip Swift when he published an article on the subject on June 17, 2019. The article titled: “The Golden Ratio Multiplier: Unlocking the mathematically organic nature of Bitcoin adoption,” helps a trader get more perspective on multi-year cycles.

A 2019 chart of the Golden Ratio Multiplier shared by Philip Swift on Twitter.

“The article starts by noting how the 350-day moving average has acted as an axis for Bitcoin’s major market cycles – once we break out, a new BTC bull run begins,” Swift tweeted two years ago. Swift continued further by saying:

The new insight begins when that important moving average is multiplied by key numbers: the golden ratio (1.618) and numbers in the Fibonacci sequence (1,2,3,5,8,13,21). In doing so we are able to pick out almost all the major intracycle price highs in Bitcoin’s history (coloured lines) AND each market cycle top (dotted lines). See 2015-17 bull run as a clear example of the MA multipliers acting as major resistance at the intracycle highs.

Bitcoin’s Numerical Sequence Like Fibonacci Poetry and Nautilus Shells

Of course, not everyone agrees with using the golden ratio and the Fibonacci sequence to predict bitcoin busts and booms. For instance, Alvaro Fernández from the open insurance platform Nsure Network remarked: “Historically it seemed to be respected, but how much could you trust it? We might as well pass through the first accumulation high.” Other critics believe using the golden ratio and the Fibonacci sequence is no different than using tarot cards.

Despite the skeptics, Swift’s bitcoin tool the Golden Ratio Multiplier is well respected and used by a myriad of technical analysts. The golden ratio has been utilized since the time of the ancient Greeks and many believe it’s deeply associated with the universe and nature. Similar to the golden ratio, Satoshi Nakamoto’s invention is a renowned and irrational technology by design. Interestingly, bitcoin’s epic price rise since it was first traded has followed the number phi and Fibonacci sequence patterns intimately.

In the same way as the Golden Ratio Multiplier, the leading asset has followed succinctly with a “natural long-term power-law corridor of growth,” according to Harold Christopher Burger. Burger published a comprehensive article that discusses bitcoin’s logarithmic growth curves. Like Swift’s Golden Ratio Multiplier, logarithmic growth curves can also give a trader an idea of when they can expect busts and booms and specific time frames. But these tools have allegedly been debunked on occasion and the golden ratio is often considered a fairytale.

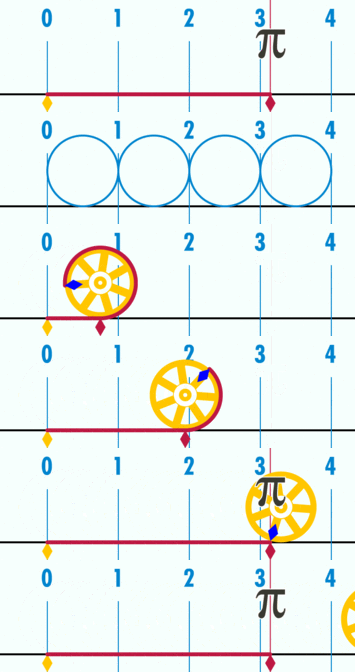
Similar to the Nautilus shell, bitcoin’s price has often been associated with the golden mean and Fibonacci sequence. The Nautilus shell is often compared and associated with the golden ratio, but contrarian research and further considerations say that the famous shell shape is not a good example of the golden ratio logarithmic spiral found in nature. Studies show the Nautilus shell has phi proportions but follows a 4:3 ratio.

What do you think about using the golden ratio and Fibonacci sequence to predict future bitcoin prices? Let us know what you think about this subject in the comments section below.

Go to Source

Bearish Bitcoin bites, fears of further falls, regulation woes build: Hodler’s Digest, May 23–29

Bearish signals are growing in the crypto markets as tighter regulations and environmental concerns cast a dark shadow over Bitcoin.

Coming every Saturday, Hodler’s Digest will help you track every single important news story that happened this week. The best (and worst) quotes, adoption and regulation highlights, leading coins, predictions and much more — a week on Cointelegraph in one link.

Top Stories This Week

Bearish signals grow as Bitcoin price drops to $35,000 and traders ignore the dip

Bitcoin is struggling right now. The cryptocurrency has struggled to keep its head above $40,000 this week as traders react negatively to twin threats of environmental concerns and the growing drumbeat of regulation.

We’ve seen a lot of downside moves across the market over the past two weeks. Although most institutional investors have held firm and vowed to continue holding onto their crypto, there’s been a lack of “we bought the dip” announcements. All of this has left retail traders worrying that BTC could suffer further declines.

The Crypto Fear and Greed Index is currently flashing a score of 18, indicating that Extreme Fear is currently paralyzing the market.

Bitcoin can still drop to $20,000 but holding remains winning strategy, data shows

Yes, there are some rather dire warnings out there, but Bitcoin’s 11-year history does help offer an insight into how the world’s biggest cryptocurrency fares when things turn bearish.

The BTC/USD exchange rate typically rises parabolically. It later trims more than half of those gains down as profitable traders sell the top. But, at the same time, traders who buy Bitcoin around its local top suffer longer periods of losses.

Overall, the historic price trajectory of Bitcoin remains skewed to the upside. The cryptocurrency bottoms out after every bullish-to-bearish cycle and rebounds all over again to seek new all-time highs.

PlanB, the creator of the stock-to-flow model that predicts BTC will hit $288,000 by 2024, recently delivered this powerful fact: Not a single investor who has held Bitcoin for more than four years has ever suffered losses.

Shutting down Bitcoin is impossible, Ark Investment founder says

With China imposing a crypto crackdown, the Biden administration reviewing “gaps” in the regulation of digital assets, Iran banning BTC mining until September to preserve electricity, and Australia warning that traders who don’t report crypto profits will face consequences, regulation is certainly stepping up a gear.

But when it comes to whether Bitcoin itself is in danger of being shut down, Ark Investment founder Cathie Wood believes this would be “impossible.”

At CoinDesk’s Consensus 2021 conference, she predicted global regulators “will be a little more friendly over time” toward cryptocurrencies due to the fear of missing out on opportunities provided by the industry.

With miners now willing to prioritize renewable sources of energy for BTC mining, Wood said: “Half of the solution is understanding the problem.”

Michael Saylor says Bitcoin Mining Council required to combat “hostile” narrative

According to MicroStrategy CEO Michael Saylor, part of this quest to understand the problem involves the creation of the Bitcoin Mining Council.

This organization, announced on May 25, was formed following a successful meeting between Elon Musk and a number of top North American mining firms.

During the Consensus 2021 conference, Saylor said: “It turns out that Bitcoin miners don’t actually have a good forum for communicating how they generate their energy. We don’t have a standard model for Bitcoin energy usage right now, and we don’t have a future forecast model that we commonly use.”

Castle Island Ventures’ Nic Carter certainly is a fan of making things more transparent, but he believes Elon Musk isn’t the right person to lead this debate.

He explained: “Bitcoiners are still intensely skeptical of Musk, and they view him as conflicted, given that his business partially involves the sale of offsets.”

PayPal users will be able to withdraw crypto to external wallets

There were some promising developments on the adoption front this week. PayPal announced that it will allow users to withdraw digital assets to third-party wallets.

Meanwhile, Apple has revealed that it is looking for a new business development manager who specializes in alternative payments, including cryptocurrency — signaling that the iPhone manufacturer is gravitating toward digital assets.

While the job posting is compelling, Apple remains largely on the sidelines of the cryptocurrency industry and has yet to signal definitive plans for expanding into this market. Interestingly, cryptocurrency exchange Coinbase recently overtook TikTok as the most downloaded app on Apple’s App Store.

Winners and Losers

At the end of the week, Bitcoin is at $36,514.09, Ether at $2,515.33 and XRP at $0.90. The total market cap is at $1,589,854,165,444.

Among the biggest 100 cryptocurrencies, the top three altcoin gainers of the week are Helium, BakeryToken and Polygon. The top three altcoin losers of the week are Waves, Solana and UNUS SED LEO.

For more info on crypto prices, make sure to read Cointelegraph’s market analysis.

Most Memorable Quotations

“I believe Bitcoin has a long way to fall from here. I think it will slowly grind down the slope of hope with a periodic dead cat bounce. Bitcoin’s technicals are severely damaged, it is better to be the first one to sell into the bubble before the whole ship sinks.”

BiotechValley Insights

“It turns out that Bitcoin miners don’t actually have a good forum for communicating how they generate their energy. We don’t have a standard model for Bitcoin energy usage right now, and we don’t have a future forecast model that we commonly use.”

Michael Saylor, MicroStrategy CEO

“Spoke with North American Bitcoin miners. They committed to publish current & planned renewable usage & to ask miners WW to do so. Potentially promising.”

Elon Musk, Tesla CEO

“No-coiners are taking this opportunity to buy the dip.”

Willy Woo, statistician

Prediction of the Week

Bitcoin price volatility hits 2021 high as one analyst paints $15,000 target

BTC’s 30-day volatility is at a yearly high, suggesting that the flagship cryptocurrency remains at risk of wild price fluctuations in the sessions ahead.

Things are even crazier when it comes to Ether. Data from Skew suggests ETH/USD’s realized volatility on a 30-day timeframe is now near 2017 highs.

One dire prediction this week came from an analyst at BiotechValley Insights, who said: “I believe Bitcoin has a long way to fall from here. I think it will slowly grind down the slope of hope with a periodic dead cat bounce.”

Their current price target? $15,000 to $16,000.

FUD of the Week

SEC charges five for illegally prompting $2 billion Bitconnect Ponzi

Three years and some unforgettable memes later, the United States Securities and Exchange Commission has announced that five individuals will face charges relating to promoting the Bitconnect Ponzi scheme.

The promoters are accused of offering and selling securities without registering with the offering with the SEC and validating themselves as broker-dealers — in violation of the law.

They also allegedly “advertised the merits of investing in BitConnect’s lending program to prospective investors, including by creating ‘testimonial’ style videos and publishing them on YouTube, sometimes multiple times a day.”

The SEC’s Lara Shalov Mehraban said: “We will seek to hold accountable those who illegally profit by capitalizing on the public’s interest in digital assets.”

U.K. regulator bans crypto exchange’s ‘time to buy’ Bitcoin advert

Britain’s advertising regulator has banned an ad campaign that told people “it’s time to buy” Bitcoin.

Luno’s posters had caused quite a splash earlier this year, and were plastered across the London Underground transit network and on buses. One ad said: “If you’re seeing Bitcoin on the Underground, it’s time to buy.”

However, the Advertising Standards Authority concluded that the campaign failed to illustrate the risk of investing in BTC. It said: “We considered that consumers would interpret the statement ‘it’s time to buy’ as a call to action and that the simplicity of the statement gave the impression that Bitcoin investment was straightforward and accessible.”

Future adverts will need to carry a proper risk warning.

China to socially blacklist Bitcoin miners in Inner Mongolia region

New penalties are introduced to try and deter people from mining Bitcoin in Inner Mongolia.

Reports suggest offenders will now be placed on a social credit blacklist — something that would stop them from being able to access loans or even use the local transport network.

The new rules make particular mention of data centers, industrial parks, telecoms companies, internet firms and even cybercafes, noting that any such offenders found operating mining equipment would have their business license revoked, could be removed from the local electricity trading scheme, and could even have their businesses shut down entirely.

China’s determination to rid itself of Bitcoin miners has already had a knock-on effect. Three mining companies — BTC.TOP, Huobi and HashCow — announced they were closing down their operations in the Chinese mainland earlier this week.

Best Cointelegraph Features

Carbon-neutral Bitcoin funds gain traction as investors seek greener crypto

Steps are being taken to ensure green Bitcoin options for investors, but this may only serve as a short-term solution to a long-term problem.

For the long haul? When Bitcoin nosedived, institutions held fast

Institutional investors know crypto assets are volatile: “They’re making a generational bet and are not deterred by a few weeks of volatility.”

Go to Source

Here’s how traders use call options to increase their Bitcoin holdings

Learn how pro traders use covered call strategies as a low-risk method to increase their Bitcoin holdings.

Crypto traders are drawn to the market by its bombastic growth and lucrative opportunities to make a profit. However, not every investor is seeking volatility or using degenerate leverage levels to gamble at derivatives exchanges. 

In fact, stablecoins usually comprise half of the total value locked (TVL) on most decentralized finance (DeFi) applications that focus on yields.

There’s a reason why DeFi boomed despite Ethereum network median fees surpassing $10 in May. Institutional investors are desperately seeking fixed income returns as traditional finance seldomly offers yields above 5%. However, it is possible to earn up to 4% per month using Bitcoin (BTC) derivatives on low-risk trades.

Non-investment grade bonds yield. Source: U.S. Federal Reserve

Notice how even non-investment grade bonds, far riskier than Treasury Bills, yield below 5%. Meanwhile, the official inflation rate in the United States for the past 12 months has stood at 4.2%.

Paul Cappelli, a portfolio manager at Galaxy Fund Management, recently told Cointelegraph that Bitcoin’s “inelastic supply curve and deflationary issuance schedule” make it a “compelling hedge against inflation and poor monetary policies that could lead to cash positions becoming devalued over time.”

Centralized services such as Crypto.com, BlockFi, and Nexo will typically yield 5% to 10% per year for stablecoin deposits. To increase the payout, one needs to seek higher risks, which does not necessarily mean a less known exchange or intermediary.

Stablecoin yields on centralized services. Source: loanscan.io

However, one can achieve a 2% weekly yield using Bitcoin derivatives. For those instruments, liquidity currently sits at centralized exchanges. Therefore the trader needs to factor in counterparty risk when analyzing such trades.

Selling a covered call can become a semi-fixed income trade

The buyer of a call option can acquire Bitcoin for a fixed price on a set future date. For this privilege, one pays upfront for the call option seller. While the buyer typically uses this instrument as insurance, sellers are usually aiming for semi-fixed income trades.

Each contract has a set expiry date and strike price, so potential gains and losses can be calculated beforehand. This covered call strategy consists of holding Bitcoin and selling call options, preferably 15% to 20% above the current market price.

It would be unfair to call it a fixed income trade as this strategy aims to increase the trader’s Bitcoin balance, but it doesn’t protect from negative price swings for those measuring returns in USD terms.

For a holder, this strategy does not add risk as the Bitcoin position will remain unchanged even if the price drops.

Bitcoin June 4 call options markets. Source: Deribit

Considering that Bitcoin was trading $37,000 when the above data was gathered, a trader could sell the $44,000 call option for June 4, maturing in six days. Depositing a 0.10 BTC margin should be enough to sell 0.30 BTC call option contracts, thereby receiving 0.00243 BTC in advance.

Two outcomes: higher Bitcoin quantity or larger USD position

There are essentially two outcomes, depending on whether Bitcoin trades above or below $44,000 at 8:00 am UTC on June 4. The $44,000 call option will become worthless for any level below this figure, so the option seller keeps the 0.00243 BTC advance payment in addition to the 0.10 BTC margin deposit.

However, if the expiry price is higher than $44,000, then the trader’s margin will be used to cover the price difference. At $46,000, the net loss is 0.011 Bitcoin, therefore reducing the margin to 0.089 ($4.094). Meanwhile, at the time of the deposit, the 0.10 Bitcoin margin was worth $3,700.

Indeed the covered call option seller would have made more money by holding the 0.10 Bitcoin from the beginning, as the price increased from $37,000 to $46,000. Nevertheless, by receiving the 0.00243 BTC advanced payment, one will increase the Bitcoin holdings even if the price moves below $37,000.

That 2.4% profit in Bitcoin terms will happen for any expiry below $44,000, which is 18.9% higher than the $37,000 when Deribit option prices were analyzed.

The views and opinions expressed here are solely those of the author and do not necessarily reflect the views of Cointelegraph. Every investment and trading move involves risk. You should conduct your own research when making a decision.

Go to Source

Ethereum Price Prediction: ETH/USD Rebounding Moves Weakened

Rebounding Moves weakened – May 29
As currently being witnessed in most of all crypto-economies generally that they now face an uglier trading situation as paired with the US Dollar, that of Ethereum versus the US Dollar isn’t different. The crypto’s price rebounding moves weakened to trade around the level of $2,300 at about a -4.71% depreciation.

Rebounding Moves Weakened: ETH Market
Key Levels:
Resistance levels: $2,500, $3,000, $3,500
Support levels: $1,800, $1,500, $1,200

ETH/USD – Daily Chart
The ETH/USD daily chart showcases a return of a falling force after attempting to swing in a recovery-moving manner. The crypto rebounding moves weakened presently after hitting resistance around the trend-line of 14-day SMA on May 27. The bearish trend-line drew across the 14-day SMA to make a strong indication of the level of $2,500 as the key resistance trading area. The 50-day SMA indicator is underneath the trend-line of the smaller SMA. The Stochastic Oscillators have slightly crossed the hairs near below range 40 seemingly trying to point toward the south direction to suggest the probability of getting to a line of reductions in the crypto trade.

ETH/USD rebounding moves weakened, will it be furthermore?
The ETH/USD price rebounding moves weakened seems now to return to the recent lowly point from which it started the upward movement. Another technical viewing point of this trade reveals that the last degree of downward moves wasn’t too far from being in correctional. Hence, the reason the bigger SMA is been trading around. Bulls have been easy finding support especially, while the bigger is breached downward.

As regards the downward movement continuation of this crypto-economy, bears have the level of $2,500 as the major point of resisting the upsurge being prepared by the base instrument. A breakdown of a point at $2,100 will energize furtherance of getting lower value in no time. However, some amount of cautiousness needs to be exercised by traders launching sell positions at that level.

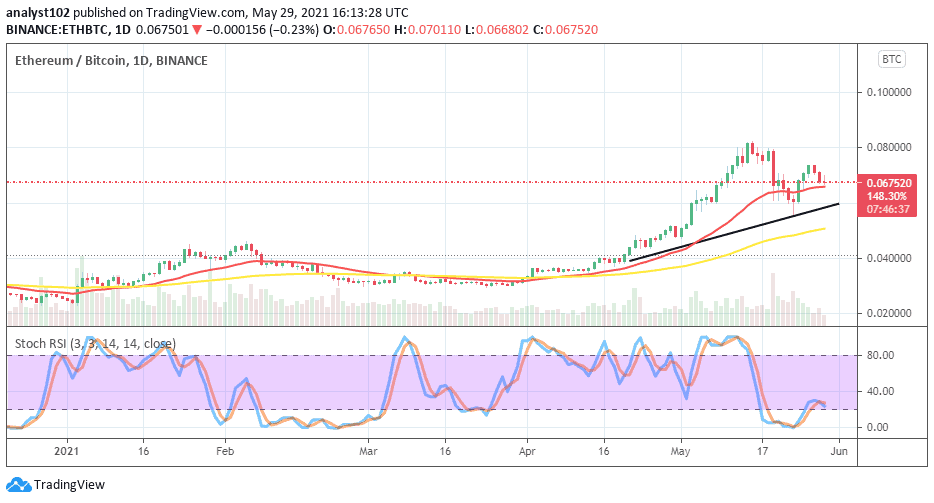
ETH/BTC Price Analysis
comparing the market trending capacity pairing of Ethereum with Bitcoin, the former appears to have only faced a downward correction as inflicted on the market by the latter instrument. All in all, ETH still posses a more trending capacity outlook than BTC. Price has now only reversed from the top close to the trend0line of 14-day SMA as it is situated over the 50-day SMA indicator. The bullish trend-line drew in a supportive posture to the smaller SMA to indicate the trend path as being bullish despite a line of variant price corrections. Having positioned between the oversold region and range 20, the Stochastic Oscillators have slightly closed the hairs. That could mean that less active movements may soon surface between the two cryptos.

Go to Source

Layer 2 network Arbitrum ships guarded launch, attracts major DeFi protocols

The optimistic rollup network enjoyed had a popular, if rocky, beta launch.

In a landscape of so-called scaling solutions primarily composed of sidechains and EMV-enabled competitors, one widely anticipated “rollup” layer 2 sidechain for Ethereum has finally arrived. 

Offchain Labs announced the launch of Abritrum One with a blog post late last night. Arbitrum One is currently live on Ethereum in a beta state, though teams that wish to participate and build implementations with the rollup tech need to apply for access:

The market has long been eager for a true layer 2 scaling solution, and according to the team the demand for Arbitrum out of the gate has been robust. 

“The developer interest and enthusiasm for Arbitrum has exceeded our wildest expectations,” reads the announcement. “Over 250 teams have requested access for our developer launch, and we can’t wait to see what they build on Arbitrum and how much gas savings this will enable.”

Development teams have been eager for rollup scaling solutions dating back years. Arbitrum works by batching, or rolling up transactions on a gasless sidechain with a separate, more efficient set of security and consensus guarantees, then reporting the batched transactions to the Ethereum chain.

While popular, some critics have said that the rollout of the rollup platform was sloppy and that the team failed to include some of the most important DeFi protocols. Curve Finance’s official account took to Twitter to gripe about not being included in the cohort of projects with access at launch, despite reportedly having significant communication with the Offchain Labs team and being among the most important money legos across the ecosystem:

The launch has also prompted some complex governance decisions. Despite previously committing to use Optimism as a layer 2, a proposal on Uniswap’s governance forums to explore an Arbitrum implementation has proven to be enormously popular. 

The Arbritrum team promised that a bevvy of major names will be revealed during a coming marketing push, however:

“We’ve begun doing a series of announcements with Arbitrum ecosystem partners, and stay tuned for many more in the coming days. It’s an exciting period ahead, and we’re working hard to make sure that all of your favorite apps and infrastructure will be live and ready when we open Arbitrum One to all users.”

Go to Source

Grayscale Bitcoin premium rebounds as BTC price falls below $35K — What does it mean?

A recent market outlook published by Glassnode shows institutions are returning to the Bitcoin market after May 19 crash.

Bitcoin (BTC) has crashed by around 44% from its all-time high of $64,899, signaling an end to its second-largest bull run that started in March 2020. Many analysts, including those from BiotechValley Insights, see “terrible technicals” in the Bitcoin market, noting that the flagship cryptocurrency could extend its ongoing decline until $20,000.

Nevertheless, Glassnode Insights, a weekly newsletter issued by on-chain data analytics service Glassnode, anticipates a Bitcoin price recovery in the sessions ahead, based on an on-chain indicator that serves as a metric to gauge institutional interest in the cryptocurrency.

Enough with discounts

Dubbed as Grayscale Premium, the metric tracks the capital flows into the Grayscale Bitcoin Trust (GBTC) — the largest investment vehicle for institutional investors looking to gain exposure in the Bitcoin market.

A rising Grayscale Premium shows a higher bitcoin inflow into Grayscale Bitcoin Trust. That prompts GBTC to trade at a premium with respect to the BTC spot price. Conversely, a lowering Grayscale Premium conveys a declining BTC inflow, prompting GBTC to trade at a discount to Bitcoin spot pricing.

The Grayscale Bitcoin Trust attracted more than 50,000 BTC to its reserves throughout January 2021 and the first half of February 2021. GBTC traded at a 10-20% premium in the said period, showing a rising institutional interest.

Grayscale BTC holdings so far in 2021. Source: Glassnode

Nevertheless, the premium fell below 10% in the first half of February. GBTC started trading at discounts to spot pricing. The same period saw the BTC/USD spot rate climbing from lower $30,000s to almost $65,000 in April. By then, GBTC premium had flipped below zero.

On May 13, just ahead of the Elon Musk-led Bitcoin market crash on May 19, the GBTC premium reached a peak low of 21.23%. It showed that institutional demand for bitcoin investment products had softened since late February.

But the May 19 price crash improved the Grayscale Premium, noted Glassnode Insights. The metric recovered to -3.8%, suggesting that institutional interest, “or at the very arbitrage trader conviction,” rose in tandem with declining Bitcoin spot prices. 

Grayscale Premium recovering after GBTC at a discount 3 months in a row. Source: Glassnode

The Canadian Purpose Bitcoin ETF underwent a similar discounting trajectory, witnessing consistent capital inflows through late April and early May and outflows later in a sign of weakening institutional demand. Glassnode noted:

“However, similar to GBTC, demand flows appear to be recovering meaningfully in following the price correction with inflows back on the rise as of late-May.”

Buying the Bitcoin price dip?

The contrast between lower Bitcoin spot rates and recovering GBTC prices conveyed that institutions have not outright abandoned the crypto market. Instead, it shows that the sell-off has motivated investors to gain exposure in both Grayscale Bitcoin Trust and Canadian Purpose Bitcoin ETF. Glassnode wrote:

“Institutional products GBTC and the Purpose ETF are showing signs of recovery despite collapsing prices providing early signs of renewed institutional interest.”

The analytics portal also referred to metrics that showed that the majority of sellers in the latest BTC price run-down appeared to be short-term holders. Meanwhile, long-term holders bought the price dip “with conviction.”

Go to Source

VORTECS Report: How volatility drove one crypto trading strategy to 280x Bitcoin’s gains

While Bitcoin hodlers are seeing 2021’s gains slowly diminish, one consistent crypto trading strategy has delivered over 3,000% since Jan 3 — and BTC isn’t in the portfolio.

What does a highly volatile asset class offer traders, beyond palpitations and the occasional heart attack? Opportunity.

Nicole Wirick of Prosperity Wealth Strategies in Michigan summed it up for Forbes: “Market volatility is a normal part of investing and is to be expected in a portfolio. If markets went straight up, then investing would be easy and we’d all be rich.”

And during the decade-long bull market on Wall Street, some participants who should know better appear to have forgotten this, as they’ve become used to steadily-increasing stock prices over a period of years.

JPMorgan Chase CEO Jamie Dimon, who infamously referred to Bitcoin as a “fraud” in 2017, told the U.S. House Financial Services Committee this week that “My own personal advice to people is: stay away from it.” And yet at his own shareholder meeting on May 18, he said that “A lot of our clients are asking, ‘can we help them buy or sell cryptocurrency? And we’re investing in that as we speak.”

So why is the CEO of the largest bank in the U.S. investing in something that he advises the rest of us not to touch?

Volatility is at the heart of that argument: It’s a classic case of “Do as I say, not as I do.” And Dimon, and many like him in traditional financial markets, make oodles of money when markets are choppy.

Of course, no markets are choppier than crypto.

Over the past few weeks, volatility has returned to the crypto markets, pushing Bitcoin as low as $30,000 before the king of digital assets swung back to exceed $40,000 again. And altcoins have swung even more dramatically — a phenomenon which has helped Cointelegraph Markets Pro’s quantitative algorithm, the VORTECS™ Score, to post extraordinary results in automated live testing.

This chart, produced on May 28 illustrates the results of the VORTECS™ Score’s performance since Jan 3 this year, when the algorithm went live. At the time of publication, one day later, the ROI on the top strategy is now over 3,000%.

In a score-based testing scenario, the algorithm “buys” a digital asset when the VORTECS™ Score crosses a certain threshold (e.g. 80), and “sells” it when it crosses a second threshold (e.g. 75).

Without employing fancy rebalancing techniques, but simply dividing the portfolio between all assets that currently require an investment, the algorithm has delivered a return of 3,037% for its highest-performing testing strategy — buying at 80, and selling when the asset crosses 80 again on the way back down.

For comparison, Bitcoin has generated returns of just 11.2% since Jan 3, and an evenly-weighted basket of the top 100 altcoins has returned 247%.

The only reason the VORTECS™ Score can deliver outsized returns like this is because crypto markets are volatile — which presents multiple entry and exit opportunities in a shorter timeframe than enjoyed by traders in traditional markets.

That may be partly a function of the 24/7 nature of crypto trading, but it’s also partly because the risk tolerance of cryptocurrency investors is generally agreed to be significantly higher than that of Wall Street CEOs… at least for short-term investing.

So while volatility has obvious downsides, including the risk of total and permanent loss, it also has major potential upside for traders who have strong research skills.

And strong research tools.

Cointelegraph Markets Pro is available exclusively to members on a monthly basis at $99 per month, or annually with two free months included. It carries a 14-day money-back policy, to ensure that it fits the crypto trading and investing research needs of subscribers, and members can cancel anytime.

Important Disclaimer

Cointelegraph is a publisher of financial information, not an investment adviser. We do not provide personalized or individualized investment advice. Cryptocurrencies are volatile investments and carry significant risk including the risk of permanent and total loss. Past performance is not indicative of future results. Figures and charts are correct at the time of writing or as otherwise specified. Live-tested strategies are not recommendations. Consult your financial advisor before making financial decisions. Full terms and conditions.

Go to Source

Forecasting Bitcoin price using quantitative models, Part 2

A deep dive into the three bubbles Bitcoin has faced during its existence, and how the BTC halving phenomenon impacts the price.

This is Part Two of a multipart series that aims to answer the following question: What is the “fundamental value” of Bitcoin? Part One is about the value of scarcity, Part Two — the market moves in bubbles, Part Three — the rate of adoption, and Part Four — the hash rate and the estimated price of Bitcoin.

The market moves in bubbles

In recent months or even years, there’s been a lot of talk about the bubbles developing in the bond markets. Newspapers — both financial and non-financial — talked about it, with specialized television stations and prestigious “macroeconomists” from all over the world discussing how today’s world debt has negative interest rates.

It is financially counterintuitive to have to pay or lend money to someone, even if that person is a state. We are experiencing an absurd situation that has never happened before in the financial market landscape. The main cause is linked to the enormous liquidity injected into the markets by central banks, which they use as funding to avoid their own bankruptcy, only to then, prudently, reverse it back onto the states (they themselves in difficulty).

After all, John Maynard Keynes’s famous phrase reads:

“Financial markets can remain irrational for much longer than you can remain solvent.”

In actuality, this absurdity has made it possible to avoid the bankruptcy of the financial system, so it is welcome, even though it feeds irrational phenomena, such as bond markets with negative yields (and therefore senseless bond prices) and stock markets touching (not all, but most) new highs day after day.

One phenomenon that isn’t actually fueled by central bank money, that everyone labeled a meaningless mega bubble in 2017, is Bitcoin (BTC). The price of Bitcoin rose to a high of $20,000 in December 2017, coinciding with the launch of Bitcoin futures by the Chicago Board Options Exchange and the CME Group, the two largest commodities exchanges in the world, and then hit a minimum of around $3,100 in 2018, effectively losing over 80% of its value.

Does it represent the bursting of a bubble? Sure. Does it represent the end of Bitcoin? Certainly not. Could there be more Bitcoin bubbles in the future? Of course.

As always, we would like to approach the problem as analytically as possible. We reconstructed the table created by the founder of Bitcoin, Satoshi Nakamoto, using Excel, to make sure that Bitcoin was deflationary and not inflationary.

Inflation

The U.S. dollar (and all currencies in the world, truthfully, including the euro), due to inflation, is worth less and less over time. We can better understand the phenomenon if we think about the value of assets. Buying a car 40 years ago cost about 13 times less than it does today, so a nice car that cost $10,000 in 1980 would cost $130,000 today.

This phenomenon is called inflation, and it is induced by a rule that links the total value of goods in the world to the total currency in circulation. If the number of U.S. dollars in circulation doubles, the same goods will tend to cost twice as much. It “will tend” because currency is not a linear phenomenon, and it may take some time to happen.

In the 1970s and early 1980s, inflation in the United States reached rates close to 12% per year, creating many difficulties for those who didn’t have the knowledge and the means to counter it.

Deflation

Bitcoin was created with a deflationary logic, more similar to commodities such as gold and silver. This is why it’s considered by many to be the new digital gold, as it has preservation of value characteristics and not those of impoverishment, like the dollar or the euro.

Related: Is Bitcoin a store of value? Experts on BTC as digital gold

Let’s see how it was possible to create, and what the effects resulting from these choices are.

Nakamoto decided that the maximum number of Bitcoin created and available should be 21 million. (The number 21 will occur many times. It is the Greek letter phi, which we will also talk about later). He could have decided to enter a fixed amount of Bitcoin for each block that got mined, but doing so wouldn’t have created the exponential growth effect that characterizes Bitcoin, or at least not as marked as it is today.

Consequently, he decided to halve the amount of newly issued Bitcoin every four years, to create a very marked and interesting stock-to-flow effect that would push the price higher and higher.

Related: Bitcoin Halving, Explained

For the first 210,000 blocks, miners were paid 50 BTC for each block written on the distributed ledger, at a time where the value of Bitcoin fluctuated from a few cents up to a few dollars, so the remuneration was not in the least comparable with that of today — neither was it as difficult to win the challenge. In fact, in the early years, simple computers were enough to do the mining.

The first halving took place in 2012 — i.e., from the 210,001st block onward, remuneration was halved to 25 BTC for each writing on the distributed ledger. In 2016, the second halving took place, which brought the remuneration down to 12.5 BTC, and again with the third halving taking place in May 2020, bringing the remuneration for each block to 6.25 Bitcoin, which with a recent price correction of around $40,000 is still around $250,000.

Related: 3 good reasons why $30,000 is probably the bottom for Bitcoin

The next halving is scheduled for 2024, when remuneration will be further cut by 50%. It is set to continue, probably, until 2140, the year in which the last halving is expected, which will distribute less than 1 Bitcoin in the last year.

But how does this halving phenomenon impact the price of Bitcoin? Does the halving of the so-called “flow,” or the flow of new capital into the market, affect the price of Bitcoin itself? As we saw previously in the first part, Bitcoin seems to follow the stock-to-flow model; therefore, a reduction in flow, while maintaining the same stock, should correspond to an increase in price. Now that we’ve had three halvings, shouldn’t there have been as many bubbles?

Do you know how many bubbles Bitcoin has had in its short life? Three fatalities. They are represented graphically below.

These are the three bubbles Bitcoin has faced so far, and each time the next maximum price became at least 10 times higher. Obviously, it is not a guarantee that it will do so in the future, but there are many factors that lead us to believe that what we experienced in 2017 will not be the last bubble — many more will follow in the future.

Can this information be used to determine a correct price for Bitcoin? Or at least, a potentially achievable price according to this model?

In fact, we can, if we take a look at this graph where the halvings are highlighted by jumps in the X-axis, in correspondence with the change in status of halving, we can estimate the fair value price — that is, the correct price at which Bitcoin could tend toward.

If the price of Bitcoin tends to return around the line described in the figure above, it is clear that we can estimate what the future target price of Bitcoin will be, based on the various halvings that await us.

From the graph, it is clear that the target price of Bitcoin is between $90,000 and $100,000. This information is very useful not only because it guarantees that we will arrive at those prices but because we should take into account our investment decisions, as it could actually get there and even exceed those price levels.

Obviously, these estimates must be taken as an intellectual attempt to understand the dynamics of Bitcoin and absolutely cannot be considered a suggestion or advice from the author. Understanding how Bitcoin can reach such values is not easy, and anyone approaching this fascinating world for the first time would have a hard time imagining how a seemingly worthless asset could have such a high price, especially if you fall into the trap of thinking of it as a dollar-par currency.

To do this, it is important to know its various aspects. One that is certainly fundamental for determining the price of Bitcoin is the adoption rate, which is to be described in the next part.

This article was co-authored by Ruggero Bertelli and Daniele Bernardi.

This article does not contain investment advice or recommendations. Every investment and trading move involves risk, and readers should conduct their own research when making a decision. The views, thoughts and opinions expressed here are the authors alone and do not necessarily reflect or represent the views and opinions of Cointelegraph.

Ruggero Bertelli is a professor of financial intermediaries economics at the University of Siena. He teaches banking management, credit risk management and financial risk management. Bertelli is a board member of Euregio Minibond, an Italian fund specializing in regional SME bonds, and a board member and vice president of Italian bank Prader Bank. He is also an asset management, risk management and asset allocation advisor for institutional investors. As a behavioral finance scholar, Bertelli is involved in national financial education programs. In December 2020, he published La Collina dei Ciliegi, a book about behavioral finance and the crisis of financial markets.
Daniele Bernardi is a serial entrepreneur constantly searching for innovation. He is the founder of Diaman, a group dedicated to the development of profitable investment strategies that recently successfully issued the PHI Token, a digital currency with the goal of merging traditional finance with crypto assets. Bernardi’s work is oriented toward mathematical model development, which simplifies investors’ and family offices’ decision-making processes for risk reduction. Bernardi is also the chairman of investors’ magazine Italia SRL and Diaman Tech SRL, and is the CEO of asset management firm Diaman Partners. In addition, he is the manager of a crypto hedge fund. He is the author of The Genesis of Crypto Assets, a book about crypto assets. He was recognized as an “inventor” by the European Patent Office for his European and Russian patent related to the mobile payments field.

This article has been successfully submitted to the World Finance Conference.

Go to Source

Ethereum Addresses Holding 0.01+ ETH Hits New All-time High of 15.71M

  • The number of Ethereum addresses holding 0.01+ ETH has hit a new all-time high of 15.71 million
  • This is indicative of growth in the Ethereum ecosystem through use of ETH or holding as an investment
  • Ethereum investors keep locking their funds in the ETH2.0 contract that now has 5.179M ETH
  • Ethereum’s $2k is the level to watch during the weekly and monthly closes

The number of Ethereum addresses holding 0.01 ETH or more has hit an all-time high of 15,710,361. This milestone was observed and shared by the team at Glassnode through the tweet below.

Such a High Number of Addresses with 0.01+ ETH Points to Use and/or Holding

Such a high number of Ethereum addresses holding 0.01 ETH or more is indicative of two things. Firstly, the Ethereum ecosystem is growing with more users joining the network to utilize the various DeFi platforms or are using ETH to pay for gas in other ERC20 token transactions. Secondly, it could also mean that more retail investors are buying and holding Ethereum for the long term.

5.179M Ethereum Locked in the ETH2.0 Deposit Contract

Ethereum investors playing the long game are best exemplified by those locking their ETH in the Ethereum 2.0 contract. At the time of writing, 5,179,010 ETH worth $12.243 billion is currently locked in the Ethereum 2.0 deposit contract. This amount continues to grow by the day as investors and users of Ethereum continue to show their support for the upgrade.

Ethereum’s $2k Support is the Level to Watch

In terms of price action, Ethereum is currently trading above the 100-day moving average (yellow) as seen in the chart below. This moving average is providing adequate support for Ethereum at current levels of $2,300.

Also from the chart, it can be observed that Ethereum is also trading above the 200-day moving average (green).

Ethereum maintaining a value above this MA will be crucial in determining whether ETH resumes its bullish trajectory into the month of June.

Also worth mentioning is that Ethereum’s weekly close is hours away and its monthly close is on Monday, May 31st. The latter date is also Memorial Day in the United States. As a result, the overall crypto trade volume will likely be low as both retail and institutional investors in the US, take some time off for the three-day weekend.

A drop in trade volume increases the likelihood of Ethereum retesting the psychological support of $2k between now and Monday. If this price level fails, Ethereum will have to depend on last week’s lows of $1,880 and $1,724 as its next line of defense. If these levels fail, Ethereum has the 200-day moving average at the $1,600 price area as its final line of hope before it enters bear territory.

Go to Source

Bitcoin Price Prediction: BTC/USD Dives Below $35,000 Support

Bitcoin Price Prediction – May 29

Following the $40,000 break, BTC/USD is now dropping heavily after getting rejected at $37,348.

BTC/USD Long-term Trend: Bearish (Daily Chart)

Key levels:

Resistance Levels: $44,000, $46,000, $48,000

Support Levels: $27,000, $25,000, $23,000

BTCUSD – Daily Chart

BTC/USD is now showing some signs of weakness after touching the high of $37,348 today. The Bitcoin price continued to fail to make any ground above the resistance. Therefore, it has dropped by a total of 3.52% within the 24 hours of trading as it touches the daily low of $33,850. Looking at the daily chart, we can clearly see the Bitcoin price not able to remain above the 9-day moving average.

Bitcoin Price Prediction: Is Bitcoin Price Ready To Go Lower?

The daily chart reveals to us that Bitcoin (BTC) continues to develop some signs of weakness for the past few days. Therefore, the resistance provided by the 9-day moving average continues to fail each time it attempts to break, and close, above this barrier. However, the market price still remains bearish as the signal line of the Relative Strength Index (14) moves into the oversold region.

On the other hand, the Bitcoin price needs to break the $40,000 resistance to make the market bullish in nature. But, if the sellers push the market price beneath the support at $30,000, the next level of support could lie at $28,000. Wherefore, beneath this, additional supports could be found at $27,000, $25,000, and $23,000 respectively.

Moreover, should in case the bulls regroup and push higher, the first 2 levels of resistance lie at $42,000 and $43,000. Above this, BTC/USD can hit the potential resistance at $44,000, $46,000, and $48,000.

BTC/USD Medium – Term Trend: Ranging (4H Chart)

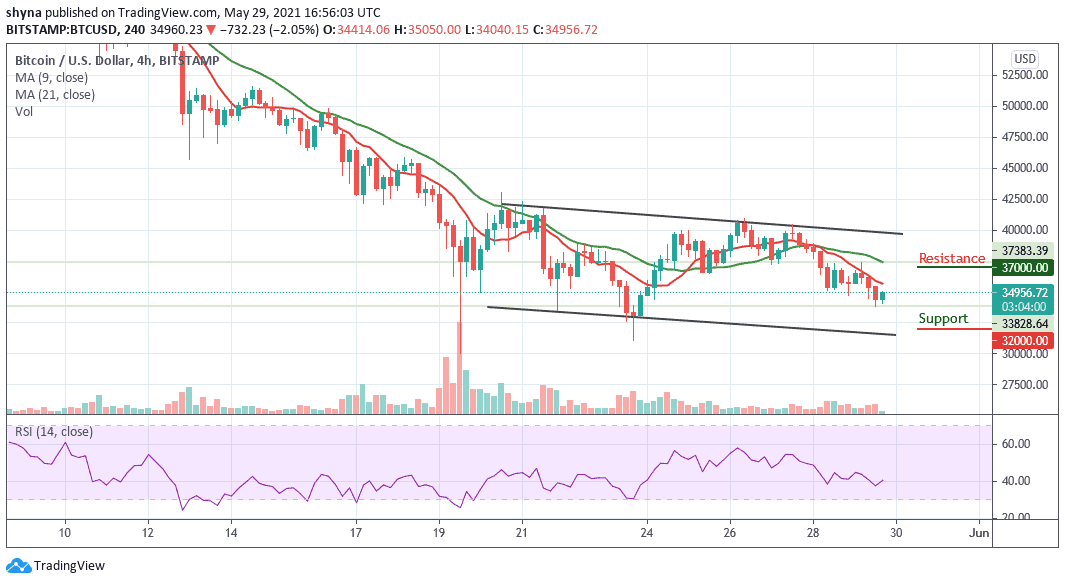
BTC/USD trades within the range of $33,000 to $40,000. Nevertheless, Bitcoin has not yet slipped below $30,000 and is still in the loop of making a bounce back from where it is currently trading at $34,956 which could take enough time before trading above $40,000. Meanwhile, the upward movement may be facing hurdles near the resistance level of $37,000 and above.

BTCUSD – 4 Hour Chart

Looking at the downside, immediate support remains around the $34,500 level while the main support is at the $33,000 level. The price might slide sharply below $32,000 which may likely test another support below the lower boundary of the channel Technically, Bitcoin is currently moving in sideways while the Relative Strength Index (14) moves around 40-level.

Go to Source

US Sends Bitcoin ATM Operator to Prison for Illegal Operation — 17 Machines Seized

A bitcoin ATM operator has been sent to federal prison for two years for running an illegal cryptocurrency exchange operation. U.S. authorities have seized 17 bitcoin ATMs, along with some cryptocurrencies, including bitcoin.

Illegal Bitcoin ATM Operator Sent to Prison

The U.S. Department of Justice (DOJ) announced Friday that a California man, Kais Mohammad, has been sentenced to two years in federal prison “for operating illegal ATM network that laundered bitcoin and cash for criminals.”

The Justice Department said that the 37-year-old operated an illegal crypto business “that exchanged up to $25 million,” some of which were “on behalf of criminals through in-person transactions and a network of bitcoin ATM-type kiosks.”

The Yorba Linda resident pleaded guilty in September last year to “a three-count criminal information charging him with operating an unlicensed money transmitting business, money laundering, and failing to maintain an effective anti-money laundering program,” the DOJ described, adding:

Mohammad has agreed to forfeit to the government 17 bitcoin ATMs, $22,820 in cash, 18.4 bitcoin and 222.5 ethereum cryptocurrency.

Mohammad owned and operated Herocoin from December 2014 to November 2019 using the moniker “Superman29.” Herocoin was a crypto exchange business that charged commissions of up to 25%, which was “significantly above the prevailing market rate,” the DOJ noted.

He typically met his clients at a public location and exchanged currency for them. “Mohammad generally did not inquire as to the source of the clients’ funds and, on certain occasions, he knew the funds were the proceeds of criminal activity. Mohammad knew at least one Herocoin client was engaged in illegal activity on the dark web,” the Justice Department said.

Mohammad also processed cryptocurrency deposited into bitcoin ATMs, supplied the machines with cash for customers to withdraw, and maintained the server software that operated the machines.

The Department of Justice said that Mohammad “intentionally failed to register his company with the U.S. Treasury Department’s Financial Crimes Enforcement Network (FinCEN)” even though he was aware of the registration requirement. He also “chose not to … develop and maintain an effective anti-money laundering program, file currency transaction reports for exchanges of currency in excess of $10,000, conduct due diligence on customers, and file suspicious activity reports for transactions over $2,000 involving customers he knew, or had reason to suspect, were involved in criminal activity,” the DOJ detailed, adding:

With respect to his bitcoin ATM network, Mohammad’s machines allowed customers to conduct financial transactions without requiring any identification and permitted customers to conduct multiple, consecutive transactions of up to $3,000 each without ever reporting suspicious activity to regulators or law enforcement.

FinCEN contacted Mohammad in July 2018 and he subsequently registered with the regulator but “continued to fail to comply fully with federal law concerning money laundering, conducting due diligence and reporting suspicious customers,” according to the DOJ.

Mohammad also conducted multiple in-person transactions with undercover agents, helping them exchange cash into bitcoin. The agents represented that they worked at a karaoke bar that employed women from Korea who entertained men in various ways, including engaging in sexual activity. “Mohammad never filed a currency transaction report or suspicious activity report for these transactions,” the DOJ said.

Do you think this bitcoin ATM operator should go to jail for two years? Let us know in the comments section below.

Go to Source

Fleeing Lynchpin of Nigerian Crypto Ponzi Scheme Inksnation Captured

The lynchpin of Inksnation, one of Nigeria’s biggest crypto Ponzi Schemes, Omotade-Sparks Amos Sewanu, has been captured. According to Nigeria’s Economic and Financial Crime Commission (EFCC), Sewanu, who was on the run, was nabbed in Sokoto, a city located in the northwest part of the country. Still, in its May 28 Twitter statement, the EFCC said it would provide details on Sewanu’s capture later.

End of the Run

The capture of the Inksnation creator comes a few months after the EFCC’s publication of a notice that asked for the Nigerian public’s help in locating him. At the time of the notice’s release, EFCC said it placed Sewanu on its wanted list for various offences which included “name dropping and fraud.”

However, in addition to these charges, the anti-graft body also said Sewanu was wanted for his involvement in the creation as well as the distribution of the Pinkcoin, an elaborate Ponzi that is packaged as a cryptocurrency. As previously reported by Bitcoin.com News, Sewanu’s Pinkcoin had already been flagged by Nigeria’s Securities and Exchange Commission.

Meanwhile, Sewanu’s arrest is now likely to trigger the collapse of a Ponzi scheme that many in Nigeria’s crypto space labelled a scam. However, despite the many warnings as well as the capture of Sewanu, few supporters of Sewanu are still defending his “innovation.”

Mixed Reaction to Sewanu’s Capture

For instance, one Twitter user named Crown expresses their exasperation with what he sees as Nigeria’s knack for destroying useful innovations. In a reply to the EFCC’s tweet, Crown said:

I just hate this country with all my heart… Someone who brings good thing that will benefit us all and stupid government says cryptocurrency a Ponzi….

However, the majority of users commended the EFCC for capturing Sewanu while some are asking the anti-graft body to go after other scammers that have similarly defrauded thousands of people. Meanwhile, at the time of writing, the EFCC had still not shared details of the capture.

What is your reaction to Sewanu’s capture? Tell us what you think in the comments section below.

Go to Source

Australian Tax Office to Prompt 400,000 Crypto Holders to Report Their Gains

Australia’s revenue service has reminded a growing number of crypto investors about their tax obligations. Rejecting the common misconception that crypto gains are only taxable when coins are cashed back into dollars, the tax office is going to prompt hundreds of thousands of taxpayers to report profits and losses from their cryptocurrency transactions.

Tax Office Targets Australians With Crypto-Related Obligations

Concerned about crypto investors evading taxes, the Australian Taxation Office (ATO) has set out to debunk the myth that cryptocurrency gains are only taxable when digital assets are converted into fiat money. People often think the digital coins are currencies but in reality, they are classified as assets, and gains from cryptocurrency trades are like gains from other investments, the tax authority explained.

ATO has estimated that 600,000 Australians have invested in cryptocurrency recently amid the surging popularity of crypto trading and rising market prices. The agency is now going to send warning letters to 100,000 taxpayers asking them to review their previously filed returns. Another 300,000 Aussies will be prompted to report their gains and losses from cryptocurrency deals as they lodge their 2021 tax return, Australian media reported.

The tax office also revealed that it’s closely monitoring the points where cryptocurrency interacts with the fiat system, helped by both the traditional financial sector and the crypto industry. The agency tracks the money back to the taxpayer using data matching profiles with cryptocurrency exchanges, according to ATO Assistant Commissioner Tim Loh who also told news.com.au:

There isn’t a game of hide and seek. We have got that information and all we are asking people to do is follow the rules. We know most Australians follow the rules.

Australian Capital Gains Tax Applies to NFTs as Well, ATO Warns

The ATO official further elaborated that the tax administration treats gains from cryptocurrency similarly to gains from shares, for example. The tax is due not only when an investor swaps cryptos for fiat money but also when one coin is exchanged for another and such transactions must be reported too. Furthermore, the Australian capital gains tax also applies to the disposal of non-fungible tokens (NFTs), Tim Loh remarked. At the same time, holding crypto funds as a long-term investment, for 12 months or more, entitles taxpayers to a discount.

A different rule applies when businesses or sole traders receive cryptocurrency for the goods and services they provide. Such payments will be taxed as income based on the value of the digital coins calculated in Australian dollars. Recognizing that the matter is quite complicated, the ATO is now focusing on helping Aussies to fill in their declarations correctly. Tim Loh advised them:

The best tip to nail your cryptocurrency gains and losses is to keep accurate records including dates of transactions, the value in Australian dollars at the time of the transactions, what the transactions were for, and who the other party was, even if it’s just their wallet address.

Loh’s comments also indicated that the Australian tax authority considers a failure to report obligations to be a bigger sin than a mistake on the declaration. “Failing to report on crypto-assets and not taking action when reminded will prompt penalties and potentially an audit,” the tax agent warned. Such penalties will be reduced significantly when taxpayers have corrected their returns.

What are your thoughts on the tax regulations for crypto investments in Australia? Let us know in the comments section below.

Go to Source

Bitcoin Price Prediction: BTC/USD Encounters Significant Reverses

Bitcoin Price Prediction – May 29
The BTC/USD market now encounters significant reverses after a strive of embarking on a rallying movement it made recently. The crypto-financial record as of the time of writing has it that the market value trades at about a -1.79% reduction around the level of $35,134.

BTC/USD Market
Key Levels:
Resistance levels: $40,000, $45,000, $50,000
Support levels: $30,000, $25,000, $20,000

BTC/USD – Daily Chart
After a line of about three days’ sessions of price converging close below the key resistance point of $40,000 between May 25 and 27. The subsequent activities until the present have been witnessing major fall-offs on a higher note while it lost momentum to break past the resistance line. The bearish trend-line still drew gone across downward the two SMAs to place a strong mark at the immediate resistance level. The 14-day SMA trend-line is underneath the 50-day SMA indicator. The Stochastic Oscillators have crossed the hairs from the overbought region to point slightly downward near range 80. The shows that the US fiat currency has potentially again begun to push the crypto market for more downs in the near time.

The BTC/USD market encounters significant reverses; will it be heightened than before?
The  crypto price encounters significant reverses are most liable to seeing  more downs Judging the next potential draw-down in the market operations of Bitcoin pairing with the US Dollar by what the Stochastic Oscillators’ reading has signaled more downsides are imminent in the near time. Intensification of downward forces as of the present time of trading will most likely put bulls on hold until a successful breakdown of the lower level of $35,000 is achieved. A price strong resurfacing below that point will possibly allow a return of energy back into the crypto economy.

Keeping the recent downtrend in a continuous moving manner, bears have again proven their stance in the market against the recent rebounding efforts made so far by the base trading instrument. It is highly expected that the level of $35,000 will be breached to the south to either revisit previous lower support or a bit lower toward the line of $25,000 afterward. However, bulls are enjoined to be on the lookout for what price will throwback during further downward depressions between $35,000 and $25,000 may in the long run.

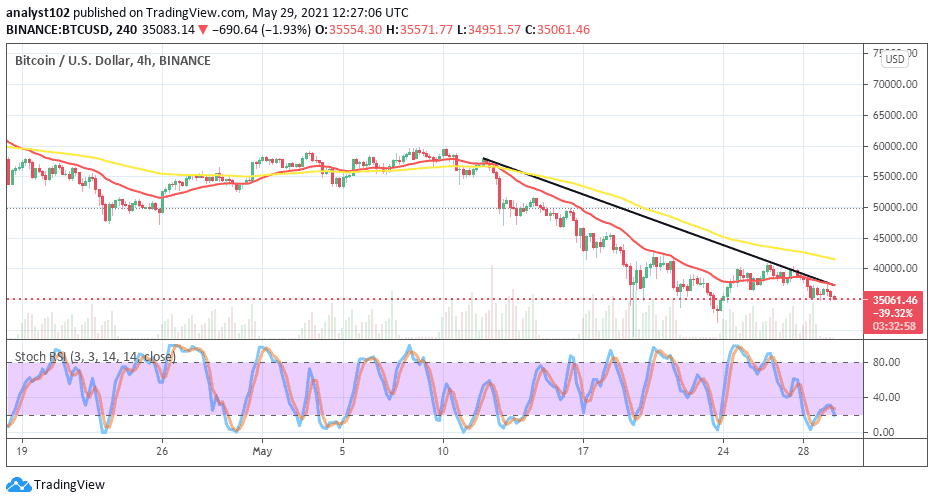
BTC/USD 4-hour Chart
The market valuation of BTC/USD has continued is still clearly depicted a complete bearish trading situation. About three different points in time, it is depicted on the medium-term chart that the BTC/USD trade encounters significant reverses. The crypto’s price now trades below the sell signal side of the SMAs. The Stochastic Oscillators have crossed the hairs toward the south a bit over range 20 to suggest featuring more downs in the next sessions. However, bearish traders need to beware of late entry to avoid getting being whipsawed eventually.

Go to Source

Please enter CoinGecko Free Api Key to get this plugin works.
Exit mobile version