Selfkey Analysis: A comprehensive review and analysis on Selfkey, which aims to provide a universal solution to digital ID.
This represents the writer’s personal opinions and does not – in any way- constitute a recommendation of an investment or financial advice. Please assume caution when investing in cryptocurrencies and do so at your own risk, as it is extremely volatile and you can lose your money.
What is Selfkey?
Selfkey is a decentralized, blockhain-based Self-Sovereign IDentification System (SSID) that enables individuals to have total and full control in owning and managing their identities. With Selfkey, users can store their identification attributes and documents in a single location on their device(s), requiring users to only input their information once. A central part of the Selfkey network is an integrated financial services marketplace, allowing users to access a wide-range of products and services using their universal digital ID.
Selfkey is the brainchild of KYC Chain, an established KYC solutions-provider for businesses that have been operating since 2013. KYC’s client base includes global banks, law firms, and immigration firms.
Selfkey is developed to address the limitations of current centralized identity systems, that include:
Security Risks: Centralized identity systems are more vulnerable to hacks and data breaches since centrally-managed databases are a single point of failure. There have been many cases – such as the case of Equifax – of personal data breaches that leads to identity thefts and significant liabilities to the system operator.
Restricted Access:Linked data is a core component of digital identity since it facilitates a more holistic verification process. However, identity owners (like you & me) are exposed to tremendous limitations to access our own linked data, which is often instituted by operators to prevent unauthorized access.
Data Protection Regulations: The differences in laws across different jurisdictions creates inefficiencies such as higher costs for small businesses and the inability of users to have total control over their identity rights.
Inefficient User Know-Your-Customers (KYC):KYC is a mandatory requirement for a wide-range of legal entities across many jurisdictions. However, the KYC process is time-consuming and costly; users must always upload the sensitive documents repetitively towards any services which are extremely inefficient and increases the risks of it landing in the wrong hands.
(See also: 4 Reasons Why Now is the Best Time for You to Invest in Cryptocurrencies)
Application
Selfkey’s ecosystem is made up of 2 core components, aside from their native token which will be explored in the next few sections:
Selfkey Wallet
An open-source digital ID wallet where users can manage and securely access their identity attributes and documents from their own personal device(s). All of the documents relating to users’ identity attributes will be stored locally in their devices, ensuring security, privacy and total control over their data. Additionally, the wallet also allows for the verification and notarization of personal documents via qualified certifiers.
A major feature of Selfkey’s wallet is that users can seamlessly and efficiently access a variety of products and services – through Selfkey’s marketplace – much more quickly since the Selfkey wallet is a universal digital ID. Selfkey’s wallet has been released (currently in beta mode) and can be downloaded here.
Here is how Selfkey’s application work:
Selfkey Marketplace
A marketplace where users can use their universal Selfkey digital ID to access a wide-range of products and services that require KYC processing, from incorporating a business to opening a cryptocurrency exchange account. There are over 300 products and services that can be accessed via the marketplace.
The marketplace feature various services that include:
Bitcoin and Digital Asset Exchange Signup
Citizenship by Investment programs
Citizenship through Investment in Real Estate Applications
Company incorporation (including companies limited by shares,
foundations, LLC’s and Trusts)
Bank account introduction and application
Residence Permit Applications for more than 50 countries
E-Wallets or Stored value facilities
Gold and Precious Metals purchase and storage
International insurance applications
Money Remittance & Transfer services
Token Sales
(Read also: Guide to Valuing Cryptocurrency: How to Value a Cryptocurrency)
Technical Overview
The technology stack of Selfkey are as follows:
Blockchain Layer: The Selfkey pairs will be derived from the Ethereum public blockchain
Validating Nodes:After testing various consensus protocols that include Ethereum’s Virtual Machine (EVM), Eris, Monax, and Tendermint, Ethereum’s normal consensus mechanism is preferred
Storage:Storage of their data is entirely up to the discretion of identity owner; users will have the complete autonomy to choose their preferred storage methods
Protocols: In a bid to ensure interoperability across different applications, Selfkey has instituted multiple standards and continual, operating work on the protocol layer with other leading identity systems. They are currently working with Sovrin, W3C, Uport and Tierion
ID Wallet: Selfkey’s open-source, native wallet is the starting point for all identity transactions. It has launched its beta version recently. KEY tokens can also be stored in the ID wallet.
ID Microservices: The company behind Selfkey’s technology and the foundation – KYC Chain – has built and provided some initial microservices such as sanction list screening (the remediator), company registry lookup, and document collection and validation (the collector)
Application Layer: Any applications or decentralized applications (dApps) can be developed on the SelfKey platform through its open API’s and open source code.
Unique Selling Point:
One-Time Digital ID for Easy Access Across Various Services: Selfkey allows users to have a single, integrated digital ID which is easily created and can be used across a wide range of services (such as financial products, exchanges, token sales). This eliminates the need for mundane KYC every single time a user needs to access a service.
(See more: Bitcoin vs Alt Coins Returns: Comparison of Gains Between Bitcoin & Altcoins Investing)
Team
Selfkey has an extensive team of over 82 employees that covers 4 main areas: Legal, Growth, Development and their Advisory board. The team is headed by Edmund Lowell, a serial entrepreneur who is also the CEO of KYC Chain. He has founded numerous companies within the incorporations and identity space, culminating in Selfkey project. Selfkey has a tech-heavy team, with 24 engineers and developers working on the tech side of things. A tech-heavy team is always a positive indicator of robust development.
Selfkey is guided by a diverse list of advisors from the cryptocurrency industry and investment banking space.
Traction
Selfkey ID Wallet Beta
Selfkey launched their Identity Wallet at the end of June 2018, allowing users to manage their digital identity as well as their cryptocurrency portfolio (Only Ether [ETH] and ERC 20 tokens). All of the user’s data are stored on their local computer/mobile devices, and the native wallet is not tied to a user’s Selfkey ID. Here’s a review of their wallet:
Dashboard
The dashboard is simple and straightforward, with functionalities similar to the most popular Ethereum/ERC20 wallet, MyEtherWallet.
Selfkey ID
Selfkey’s ID portal is easy to navigate, with clear fields for users to input their necessary ID documents. It is also easy to make edits on individuals fields in user’s ID attributes. Attaching all documents and fields would require no more than 5 minutes. Perhaps the biggest advantage is that knowing that creating a Selfkey ID is a one-time effort and that allows users to use their ID across a wide range of platforms (in Selfkey’s marketplace) without having to engage in mundane KYC-related work again. Of course, this is contingent on other services being included within Selfkey’s marketplace network.
Since the Selfkey ID is still in its Beta stage, the complete list of services, products, and partners that can be accessed is not furnished. Through this marketplace, users would be able to access a wide variety of applications and services that utilize their ID data. Since any company can build on Selfkey’s application layer through its open API and source code, it remains to be seen if there is traction on the potential service providers’ end to engage in integrating their services onto the Selfkey’s platform.
Selfkey Matketplace (Alpha Stage)
Selfkey has also developed its marketplace, which is still in its alpha stage (You can check out the alpha here). The Marketplace enables users to assess and apply for services easily, reducing the manual and paper-intensive nature of traditional KYC processing. There are over 22 categories of services that Selfkey has identified in its marketplace, with 11 categories that have been established with partners. Here are they:
Partnerships
This is perhaps the most important factor that will determine the success of Selfkey as a network. The streamlined efficiency of Selfkey’s digital ID is only as good as the availability of services that will be available on Selfkey’s marketplace; the more service providers across different markets there are, the more use cases that Selfkey’s ID would be relevant in. Therefore, it is critical for Selfkey to partner with service providers for their marketplace. Here is a list of their current partners:
Selfkey has managed to partner with established entities from a wide range of financial service providers, corporate services providers, registered agents, lawyers, consulting firms, notaries and cryptocurrency exchanges to offer the various products and services. This is a positive indicator of Selfkey’s growing network.
(Read more: Guide to Blockchain Protocols: Comparison of Major Protocol Coins)
Roadmap
Here is the roadmap and progress of Selfkey’s development:
Selfkey is close to finishing multiple deliverables such as Trezor’s hardware wallet integration, cryptocurrency exchange marketplace, KEY staking functionality and browser button/extension. It seems that each marketplace requires intensive development, and considering there are 22 marketplace categories, it could take a while before full access to all markets will be available to users.
It is, however, a prudent strategy undertaken by Selfkey to focus on the lowest hanging fruits, in the form of cryptocurrency exchanges and incorporations marketplace, where KYC Chain already has established links and infrastructure.
Token Utility
Selfkey’s native token is called KEY (stands for Key-to-Encrypt-Yourself), an ERC 20 token built on the Ethererum blockchain. KEY is a utility token that serves as the main currency on the Selfkey network. (See more: Coins, Tokens & Altcoins: What’s the Difference?)
KEY tokens will be needed to:
Access to the comprehensive range of products and services via the marketplace by staking KEY tokens in smart contracts
KEY tokens are the main currency used to pay for verification, certification and notarization services or other products such as bank account opening fees
Relying parties are required to place KEY in a locked smart contract to offer their services within the SelfKey Marketplace.
As KEY will be the main currency within the network and stakeholders (users, certifiers, and relying parties) will need to stake KEY tokens to participate, the value of KEY will rise in direct relation to an increase in network usage. That is, the more services being offered on the marketplace and the more transactions occurring on the network, the higher KEY tokens’ value will be since the total coin supply is fixed at 6,000,000,000 (6 billion) tokens.
Exchange Status
Selfkey’s KEY tokens are trading live on various exchanges that include:
Binance (BTC/ETH)
OKEx (BTC/ETH/USDT)
Kucoin (BTC/ETH)
Tidex (Not Recommended)
Gatecoin (Not Recommended)
RightBTC (Not Recommended)
It must be noted that exchanges in red should not be your exchange of choice as there is no liquidity in trading KEY tokens. An absence of liquidity makes it extremely hard to trade your coins. Here’s a guide on liquidity that explains in further detail.
(Read also: Guide to Market Capitalization: Everything You Need to Know About Market Cap)
Strengths
Unified Digital ID Solutions:Selfkey’s universal digital ID allows users to seamlessly and efficiently engage in KYC across many service providers. More importantly, the data is fully controlled and managed by the user in their local devices, thereby ensuring greater security.
Backed by An Established Business: Selfkey is developed at the back of KYC Chain, an established KYC solutions provider that already has the infrastructure, experience, and expertise in the KYC business.
Extensive Partnerships:Selfkey has an extensive list of partners that will be the service providers building an application or using the KYC functionalities of the Selfkey ID. This is proof of traction of their development which is key to their success.
Comprehensive Markets: Selfkey has currently identified 22 market categories in its marketplace. When completed, users will have access to a wide range of services using their digital ID.
Weaknesses
Competitive Industry: There are many competitors that are trying to solve the same problems as that has been around longer than Selfkey, such as Civic. However, the rate of development of competitors is progressing slowly and Selfkey has the advantage of being backed by a real business.
Long Completion Date: Selfkey’s completed product will be launched after 2019, possibly hinging at 2020 given the enormous tasks they have at hand.
Summary
Selfkey is trying to solve a tedious, but a universal problem of tedious KYC processes. With their universal ID, users can have seamless access to a comprehensive range of markets and services that require the necessary ID documents. Given the increasing legal requirements of proper KYC, Selfkey’s solution is much needed for numerous industries and businesses. Backed by an established business, extensive team and well-established partnerships, we foresee that Selfkey would be a major player in this space.
Verdict: Good Project
(Read also: Evolution of Cryptocurrency: Replacing Modern Cash)
Beneficial Resources To Get You Started
If you’re starting your journey into the complex world of cryptocurrencies, here’s a list of useful resources and guides that will get you on your way:
Trading & Exchange
Crypto Guide 101: Choosing The Best Cryptocurrency Exchange
Guide to Bittrex Exchange: How to Trade on Bittrex
Guide to Binance Exchange: How to Open Binance Account and What You Should Know
Guide to Etherdelta Exchange: How to Trade on Etherdelta
Guide To Cryptocurrency Trading Basics: Introduction to Crypto Technical Analysis
Cryptocurrency Trading: Understanding Cryptocurrency Trading Pairs & How it Works
Crypto Trading Guide: 4 Common Pitfalls Every Crypto Trader Will Experience
Wallets
Selfkey Wallet Download
Guide to Cryptocurrency Wallets: Why Do You Need Wallets?
Guide to Cryptocurrency Wallets: Opening a Bitcoin Wallet
Guide to Cryptocurrency Wallets: Opening a MyEtherWallet (MEW)
Read also: Guide on Privacy Coins: Comparison of Anonymous Cryptocurrencies and Guide To Cryptocurrency Trading Basics: Do Charts & Technical Analysis Really Work?
This represents the writer’s personal opinions and does not – in any way- constitute a recommendation of an investment or financial advice. Please assume caution when investing in cryptocurrencies and do so at your own risk, as it is extremely volatile and you can lose your money.
Enroll in our Free Cryptocurrency Webinar now to learn everything you need to know about crypto investing.
Get our exclusive e-book which will guide you on the step-by-step process to get started with making money via Cryptocurrency investments!
You can also join our Facebook group at Master The Crypto: Advanced Cryptocurrency Knowledge to ask any questions regarding cryptos!
Aziz, Master the Crypto Founder
I’m Aziz, a seasoned cryptocurrency trader who’s really passionate about 2 things; #1) the awesome-revolutionary blockchain technology underlying crypto and #2) helping make bitcoin great ‘again’!
The post Coin Analysis: Selfkey Review appeared first on Master The Crypto.
As the development of the Etheruem 2.0 upgrade progresses, cryptocurrency exchange Coinbase has announced that investors can now join the waitlist to be first in line when new Ethereum staking features launch.
One of the most prominent features of Ethereum 2.0 will be the transition to a proof of stake (POS) consensus mechanism, which will allow nodes to increase their chances to be selected to validate transactions and create new blocks based on their ETH stake instead of computational power.
Now, Coinbase is looking to be one of the first exchanges to offer rewards to users who stake their ETH in the platform, offering them up to 7.5% Annual Percentage Yield (APY) in rewards by holding their ETH.
Ethereum 2.0 requires nodes to stake a minimum of 32 ETH to generate rewards as a validator node, but Coinbase will allow any users with under 32 ETH to stake to generate rewards in their accounts.
Coinbase is Looking to the Future
Unlike staking in other networks and platforms, Coinbase users will not be able to use the staked ETH int transactions, to begin with, but it is planned for this to be possible in the months after the launch of the feature.
The exchange will also benefit from allowing users to stake their ETH, charging a commission on the rewards received to support the underlying infrastructure.
Other platforms that have announced Ethereum 2.0 staking are Kraken and MyEtherWallet, which will stake ETH on behalf of their customer in a way similar to Coinbase.
Direct Listing is Looming
As cryptocurrency continues to gather increasing attention from institutional and private investors, gaining endorsement from public figures like Elon Musk, the total market capitalization of the industry has grown by over 60% during 2021.
One of the most important pieces of news during this year was Coinbase’s official announcement of its intent to become a publicly-traded company through a direct listing, back on January 28th.
It had been speculated back in 2020 that the third largest exchange by daily trading volume would be going public via an Initial Public Offering, before the news finally being clarified by the company.
The exchange has been especially popular among large institutional investors through its Coinbase Pro platform, which has played an increasingly important role in the cryptocurrency bull run experienced over the last months.
The announcement of the direct listing filling with the Securities and Exchange Commission (SEC) will also play an in the future of cryptocurrency exchanges in the United States, as it would make Coinbase the first major cryptocurrency exchange to be publicly listed if approved.
Ethereum 2.0 Rallies Community Support
Ethereum 2.0 has been one of the most anticipated events in the crypto ecosystem since the release of its deposit contract in November of 2020, with investors depositing over 3M ETH by February 15th.
Ethereum continues to be the second most popular cryptocurrency by market capitalization despite the increase in gas prices and saturation, being the foundational network for a great number of Decentralized Finance (DeFi) platforms and Decentralized Applications (dApps)
The cryptocurrency achieved its all-time high of $1.867 back on Feb 13th of 2021, as investors remain positive on the future of the platform and the cryptocurrency market continues to soar.
With the redeployment of Ethereum 2.0, users of the Ethereum 2.0 network will be increasing the resilience of the network and improving its efficiency by holding and staking their ETH, greatly increasing the throughput of the network to fight the current saturation.
With competition from other blockchain networks for the crown increasing each day, support for Ethereum 2.0 features will prove to be essential to decide who the winner of the latest race will be.
The post Coinbase Launches Ethereum 2.0 Staking Rewards Waitlist appeared first on Blockonomi.
As the deployment of Ethereum 2.0 continues to develop, its deposit contract now holds over 3M ETH which will contribute to the security of the ecosystem.
These deposits are worth over $5.4 billion for a contract that was launched just 4 months ago and secured the amount required by the Beacon Chain for its launch in just 3 weeks, allowing it to be released in December.
Ethereum 2.0’s beacon chain will be an integral part of the new platform by allowing it to remain connected to the current mainnet, ensuring migration between the two versions is possible as well as allowing ETH holders to stake their funds.
This staking feature will also allow the blockchain network to transition to a Proof of Stake (PoS) model, which will allow nodes with a minimum of 32 staked ETH to earn the rights to validate transactions and earn rewards, a more efficient way than the current Proof of Work (PoW) algorithm.
Ethereum 2.0 Development is Powered By its Community
The development of Ethereum’s upgrade continues as the team successfully completed an R&D workshop around the future beacon chain upgrades and selected new grantees for the latest staking community grants round.
The R&D Worksop was ghosted by the Ethereum Foundation’s research team to allow devs and researchers to discuss the eth1+eth2 merge and share in the upgrade, which also shared some of the plans with presentations by Vitalik Buterin, Dankrad Feist, Mikhail Terekhov, and Guillaume Ballet.
The foundation also allocated over $1M to 25 grantees over 4 different categories. A total of $391.8 k was granted to community/education programs, $200k to new tooling, $180k for data analysis/visualization efforts, and $268.6k invested in research.
These grants will allow the community to actively take part in the development of Ethereum 2.0, as well as easing the transition and adoption by users by providing information to interested parties.
While the release of the ETH 2.0 complete release is still unknown, the development of the new version has been a matter of discussion for crypto enthusiasts and experts alike as the future of the network will depend on this upgrade.
Fee Market Changes and the Future of Ethereum
Not only has Ethereum experienced issues when it comes to scalability over the last year, but it also has seen its gas prices increase rapidly as the network gets saturated and transactions take longer to process.
This problem was partially caused by the DeFi booming and partly because of the network’s infrastructure.
These gas prices have resulted in many investors and dApps looking for alternatives in other blockchains or using L2 solutions, causing trust in the future of the network to be in jeopardy.
Vitalik Buterin, Ethereum Founder and current member of the development team, was one of the proponents of the Ethereum Improvement Proposal 1559 (EIP 1559). Titled “Fee market change for ETH 1.0 chain”, it was created back in April of 2019 to offer a solution to the increasing gas prices.
The proposal has been one of the highest anticipated upgrades to the network, and while it can be deployed independently of the eth2 upgrade, it is only clear that it will be seen on the mainnet in 2021.
This change will result in a majority of the ETH used in transaction fees being burned, as well as establish a fixed-per-block network fee that will dynamically adapt to the level of congestion experienced by the network.
This will not only result in lower gas fees that will allow dApps and investors who depend on low-value transactions to generate gains, but it will also give the cryptocurrency a deflationary trait that will allow its value to increase.
With blockchain networks like Polkadot and Cardano seeing increasing interest from developers and investors, Ethereum’s capacity to offer competitive fees and features will be essential in deciding the future of the network in an increasingly competitive ecosystem.
The post Ethereum Development Progresses: 2.0 Contract Now Holds Over 3M ETH appeared first on Blockonomi.
The Coronavirus crash of mid-March has resulted in a lot of crypto traders being cautious.
The dominance of stablecoins is proof that they are waiting for favorable crypto conditions to get back to trading.
Staking crypto on the various exchanges has provided an alternative to trading and/or storing value in stablecoins.
The Bitcoin (BTC) and crypto market crash of mid-March was one event that not too many traders believed would happen. The majority of Bitcoin enthusiasts believed that the hype surrounding the Bitcoin halving event would provide much-needed immunity for the crypto markets to survive a shake-out in the event of a possible stock market meltdown. However, the tense days of March proved that Bitcoin is highly correlated to the stock markets during times of turmoil.
$8 Billion Locked up in Stablecoins
As with all periods of unexpected volatility, traders and investors quickly hopped on stablecoins to safeguard the value of their holdings in the crypto markets. As a result, Tether (USDT) has continually risen on Coinmarketcap and is currently ranked 4th after BTC, Ethereum (ETH) and XRP. The stablecoin’s market cap currently stands at $6.4 Billion making up 80% of the total value stored in stablecoins. Tether’s dominance has slowly but surely risen due to the uncertainty brought about by the effects of COVID19 on the global economies.
Staking of TRX, KAVA and other Cryptos is Providing a Profitable Alternative
With the world firmly in the thick of a global recession, favorable trading conditions to go LONG in the crypto markets will probably take a while to present themselves. At the time of writing this, flattening the curve of infections is happening but a return to normalcy has been projected to take months and roll over into 2021 with some estimates pushing it to 2022.
Therefore, many savvy crypto investors have discovered that staking is an easier way of storing their crypto holdings while gradually increasing their bags.
Exchanges such as Binance, Bitfinex, KuCoin and Poloniex, have started offering staking services for coins and tokens already listed on their platforms.
Using Binance staking services as an example, we observe the following estimated annualized returns in the staked token/coin.
Tron (TRX): 7 – 8% pa
ATOM: 6 – 9% pa
Tezos (XTZ): 6 – 9% pa
Algorand (ALGO): 8 – 10% pa
ONE: 8- 10% pa
Fetch (FET): 8 – 12% pa
QTUM: 6 – 8% pa
TROY: 15 – 16% pa
The above list is just a brief one to give the reader a better understanding of the potential investment potential of staking.
Staking Might be a Better Alternative to Trading the Uncertainty
With the Bitcoin halving narrative of gains almost destroyed by the Coronavirus crash of March 2020, trading cryptocurrencies as they range and wick haphazardly in either direction might be one-way traders are losing trading capital through stop losses and the dreaded liquidations.
Staking, on the other hand, might be a better alternative to trading. User funds idly generate profits in a manner more attractive than holding value through stablecoins.
Vitalik Buterin Believes Staking on Phones is Promising
Additionally, in a recent tweet, the Co-founder of Ethereum, Vitalik Buterin, rubbished the idea of mining cryptocurrencies on smart-phones while at the same time identifying staking as a promising option. His tweet can be found below.
Mining on phones is a fool’s game. Goes against everything we know about hardware economies of scale and more likely to trick users with false hope than help them.
*Staking* on phones, OTOH, is IMO quite promising…https://t.co/VGgkoHIDsP
— vitalik.eth (@VitalikButerin) April 13, 2020
Summing it Up
Trading Bitcoin and alt-coins during periods of global economic uncertainty might be one way of losing trading capital. Alternatively, and with staking, investors can store the value of their trading capital in coins or tokens that will generate a handsome amount in annualized returns.
(Feature image courtesy of Micah Williams on Unsplash.)
Disclaimer: This article is not meant to give financial advice. Any additional opinion herein is purely the author’s and does not represent the opinion of Ethereum World News or any of its other writers. Please carry out your own research before investing in any of the numerous cryptocurrencies available. Thank you.
Bitcoin (BTC) encountered massive resistance as it tried to break $7,300.
At the same time, its trade volume has been dropping together with its dominance in the crypto markets.
In our analysis of Bitcoin (BTC) a few hours ago, we were cautiously optimistic that the King of Crypto was on a slow and tense journey towards $8,000. We also identified a few support zones that include $7,050, $6,900, $6,800 and $6,600.
Why $7,050 is the Level to Watch During Bitcoin’s Weekly Close
Further analyzing the aforementioned support zones, we realize that the $7,050 zone is the last area of defense for Bitcoin before it drops back to familiar levels below $7,000. Therefore, if this level breaks in the next few hours, we will most likely retest $6,900 and possibly back to our strongest support thus far of $6,600.
6-Hr BTC/USDT chart courtesy of Tradingview.com
Revisiting our favorite 6-hour BTC/USDT we begin to spot a few areas of weakness for the King of Crypto that might cause some excitement for the Bears.
To begin with, Bitcoin’s move to claim $7,300 was rejected at the same zone which was a resistance. Its current price of $7,126 is still above the 50 (white), 100 (yellow) and 200 (green) moving averages. These MAs are acting as short term support for Bitcoin, but they are also giving a picture of exhaustion for BTC.
Further checking the trade volume, it has reduced drastically in the last few days. This is a tell-tale sign of a possible move down.
The MFI has a value of 80 thus indicating an overbought situation. This is further confirmed by the MACD about to cross in a bearish manner above the baseline.
Bitcoin Dominance Continues to Drop Slowly
In our April 17th Ethereum price analysis, we had identified that the BTC dominance had dropped by 1% thus providing some level of confidence for ETH to rise in the crypto markets. Rechecking Coinmarketcap, we find that the BTC’s dominance now stands at 63.5% compared to our previous level around 64%. This slow decline in market dominance could provide the perfect environment for a mini-alt season.
Conclusion
As the third week of April 2020 comes to a close, $7,050 will be the level to watch for Bitcoin (BTC). This area provides the last line of support for the King of Crypto before falling back to familiar territory below $7,000. Also to note, is that the Bitcoin trade volume has continued to drop thus providing the case for a bearish weekly close for BTC. Additionally, Bitcoin’s dominance has continued to drop slowly further pointing to a possibility of Ethereum doing well in the crypto markets along with alt-coins.
As with all T.A opinion, the reader is advised to use adequate stop losses to protect their leveraged positions on the various cryptocurrency exchanges.
(Feature image courtesy of Kid Circus on Unsplash.com.)
Disclaimer: This article is not meant to give financial advice. Any additional opinion herein is purely the author’s and does not represent the opinion of Ethereum World News or any of its other writers. Please carry out your own research before investing in any of the numerous cryptocurrencies available. Thank you.
The Bridgewater Associates co-founder and chief investment officer, Ray Dalio, says that there is a good probability that the government will outlaw bitcoin in the same way gold was outlawed in the U.S. in the 1930s.
Ray Dalio Thinks Governments Can Outlaw Bitcoin
Ray Dalio shared his view on whether the government could outlaw bitcoin in an interview with Yahoo Finance Wednesday. He is the co-founder and chief investment officer of Bridgewater Associates, the world’s largest hedge fund firm. His clients include endowments, governments, foundations, pensions, and sovereign wealth funds.
Dalio believes that bitcoin may suffer a similar fate as gold did in the U.S. during the 1930s. “Like back in the ’30s in the war years … cash and bonds were such bad investments relative to other things, there was the movement to those other things still, and then the government outlawed them … They outlawed gold,” he recalled, elaborating:
That’s why also outlawing bitcoin is a good probability.
Besides outlawing gold, Dalio added that “they also established foreign exchange controls, because they don’t want the money to go elsewhere.”
Emphasizing that “every country treasures its monopoly on controlling the supply and demand. They don’t want other monies to be operating or competing, because things can get out of control,” the Bridgewater founder opined:
So I think that it would be very likely that you will have it, under a certain set of circumstances, outlawed the way gold was outlawed.
“You’re watching that question arise in India today. India today is making a move to outlaw it– outlaw possession of it,” he pointed out. The Indian government is currently working on a cryptocurrency bill and there have been reports that it may ban cryptocurrencies like bitcoin. However, no official announcement has been made and the crypto industry is hopeful that there will be not an outright ban on cryptocurrencies.
Dalio was also specifically asked if he thinks it is possible for the government to ban bitcoin. He replied: “My understanding from people who are sort of in government surveillance and so on, is, yes, they can understand, they can track it, they can know who’s dealing with it. I don’t know– like, I’m not an expert on that.”
The billionaire hedge fund manager has been learning about bitcoin over the recent months. He admitted in November that he may be wrong about bitcoin but was worried about governments outlawing cryptocurrency. He then said bitcoin “is one hell of an invention” that could “serve as a diversifier to gold and other such storehold of wealth assets.”
Responding to Dalio’s misinformed perspectives, bitcoiners took to social media to argue about the government’s ability to ban bitcoin. Gemini co-founder Cameron Winklevoss wrote: “Bitcoin may have similar properties to gold but outlawing decentralized software is a much different problem. It requires you to essentially outlaw the Internet.”
Some people accuse the Bridgewater executive of attempting to manipulate the market to buy cheap coins, noting that a growing number of major corporations are investing in BTC. Recently, Goldman Sachs said it sees huge institutional demand for the cryptocurrency and Visa anticipates bitcoin becoming “extremely mainstream.” Deutsche Bank says bitcoin is now the third-largest currency, after the dollar and the euro. Furthermore, Morgan Stanley is getting ready to offer bitcoin exposure to wealthy clients and other banks are expected to follow suit.
Do you think about Ray Dalio’s bitcoin warning? Let us know in the comments section below.
PRESS RELEASE. 27th March 2021, Al Murar, Dubai – Diamondcon is one of the fastest rising Call of Duty league players in the world, and part of the Subliners eSports team. He is the first ever professional eSports player to introduce an NFT into the ever-growing community of FPS gaming.
Having established a considerable following on Twitch and Twitter, his followers will soon be able to purchase an NFT of Diamondcon and claim bragging rights to that 200 IQ game clip.
Coming soon 👀 pic.twitter.com/FpGXtQ24rw
— NYSL Diamondcon (@Diamondcon_) March 19, 2021
NFTs: Hot off the Press
Gamers spend loads of cash on skins, game passes and in-game purchases, yet they never owned any of them. NFTs will be the change that revolutionizes the gaming industry. Money spent in gaming will no longer be a bad investment. No one knew about NFTs a year ago, and now it’s the new craze. Remember when they said that streaming will never be a career? Look where the industry is now.
The Diamondcon NFT will be the first in the COD universe, and owning it will be an investment that is not to be missed. Imagine how much an NFT of your favorite COD player will be worth in a few years.
For anyone who’s hyped about the release, The DiamondCon NFT is set to drop in the coming days, so keep your eyes peeled on Diamondcon’s Twitter to get this hot NFT before it sells out!
About WeAreGrowthHackers
WeAreGrowthHackers are one of the world’s premier Growth Hacking and NFT marketing agencies. They’ve made millions for their clients using little-known, (“out of the box”) growth hacking techniques and they’re now applying it to the hyper trend of the NFT world. Create your NFT and growth hack it today.
Media Contact Details
Contact Name: Bob Wazneh Contact Email: bob@wearegrowthhackers.com
WeAreGrowthHackers is the source of this content. This Press Release is for informational purposes only. The information does not constitute investment advice or an offer to invest.
This is a press release. Readers should do their own due diligence before taking any actions related to the promoted company or any of its affiliates or services. Bitcoin.com is not responsible, directly or indirectly, for any damage or loss caused or alleged to be caused by or in connection with the use of or reliance on any content, goods or services mentioned in the press release.
The non-fungible token fever witnessed over the last few months is catching the copyright management agencies’ attention. One of them, located in Italy, has chosen a blockchain company to create its own NFTs.
SIAE Expects to Guarantee Copyright Protection With NFTs for the Next 139 Years
According to the announcement, Società Italiana degli Autori ed Editori (SIAE), founded in 1883, picked Algorand to manage the rights of over 95,000 authors in the form of non-fungible tokens. Both parties had been working on the project since 2019, said Algorand.
In a first instance, 4 million NFTs were created to represent selected SIAE authors’ rights. Per SIAE, by digitizing these rights on blockchain technology, authors could ensure that their copyrights are globally protected on a transparent, open infrastructure.
Gaetano Blandini, the general manager of SIAE, pointed out that the move seeks to guarantee protection for the next 139 years. He added:
We are not interested in building technological infrastructures to generate profit. Instead, our goal has been and always will be to create value addition for our members. This is why we can afford to talk about open infrastructures and make all our know-how available to the community. Blockchain technology is definitely an interesting strand to continue exploring because of its transparency and efficiency – by design – features, which are fundamental for those who, like us, manage the salary of other people’s hard work.
Could the NFTs Become a ‘Game-Changing’ in the Copyright Management Business?
Moreover, Italy’s largest collective management organization forecasts that such a move will open the doors to transition onto new blockchain-based platforms that “will rapidly and profoundly change the business models” in the rights management industry.
Silvio Micali, MIT Professor and founder of Algorand, is optimistic about the use of NFTs to handle copyrights, and SIAE’s maneuver can also be “a game-changing” in the business:
SIAE has brought an ambitious project to life, where transparency and simplicity in data management are becoming a new reality for their industry. SIAE is a forward-thinking organization that will open up new opportunities as they build the foundations for new economic models.
What are your thoughts on using NFTs to manage copyrights? Let us know in the comments section below.
Recently, Bitcoin Cash proponents have been introduced to a new application that competes with the content subscription service Onlyfans. The web portal Onlycoins is a service that is similar to Onlyfans but instead, creators can earn bitcoin cash by posting quality content and gathering subscribers.
Youtuber David Bond Features Bitcoin Cash-Fueled Onlyfans Clone
The popular Youtuber and BCH supporter David Bond recently published a video for his 501,000 subscribers about a new app that competes with the popular content subscription service Onlyfans.
Bitcoin Cash fan and popular Youtuber David Bond discusses the Onlycoins app in his latest video.
The London-based Onlyfans basically allows creators to earn money from their fans and individuals get paid from pay-per-view (PPV) features and one-time tips. Bond told his subscribers about a new app called Onlycoins, a platform that offers similar services but pays in BCH and doesn’t take a 20% cut. Because Onlyfans provides the platform that hosts the paywalled content, the company takes a significant cut from its users’ transactions.
Onlycoins is a digital content marketplace, and creators can receive funds directly from fans just like the app’s competitor. The platform does take a cut, as Onlycoins’ commission is 10% in comparison to Onlyfans.
The Onlycoins’ commission rate outperforms all the popular fee models on well known sites like Manyvids (30%), Pornhub (32%), and Clips4sale (40%). Moreover, Onlycoins members get paid directly with bitcoin cash (BCH), as the platform offers each individual a BCH wallet. Onlycoins does detail that the project is still in its alpha phase, and stresses to only deposit small amounts of BCH on the platform for now.
Onlycoins Starts to Fill With Members and Pay-per-View Content
Registering for Onlycoins simply takes an email, and then the user can create their profile. Thanks to David Bond’s recent video and mentions on social media platforms like noise.cash, the website onlycoins.app is already filling up with members.
Of course, similarly to Onlyfans, the BCH-fueled Onlycoins has a bunch of adult-themed entertainment. Right now, scanning through the website’s feed, PPV features for pictures from a number of Onlycoins members can cost between $0.10 to upwards of $1 to unlock the content.
The Onlycoins developers also note that as development continues, the site may progress to a more “polished form,” at which time the commission rate may change. However, Onlycoins emphasizes that It is “absolutely our intention to remain cheaper than any relevant competition.” By leveraging a peer-to-peer cryptocurrency like BCH, the platform could easily continue offering competitive commission rates.
What do you think about the Onlycoins app? Let us know what you think about this subject in the comments section below.
Live Real-Time Bitcoin Price in BTC/USD Exchange Rate Value
The most asked question in today’s cryptocurrency ecosystem is: what is the price of Bitcoin.
$9,522.08
Bitcoin (BTC)
1h0.00%
24h1.69%
USD
EUR
GBP
This bitcoin price guide is split up into four major analysis to understand how the BTC/USD exchange value rate works. First is the live real-time BTC price chart above, followed by these three core components:
what the bitcoin exchange rate means (how the pricing formula of BTC in USD updates)
most popular economic crypto market factors driving the price of bitcoin up (or down)
historical bitcoin price timeline of events with chronological dates and BTC in USD news
What Does Bitcoin (BTC) Price’s USD Exchange Rate Mean?
Bitcoin (BTC) Rank: 1
$9,522.08
Price (BTC)
Ƀ1.00000000
Marketcap
$175,317,706,609
Volume
$21,832,492,541
24h Change
1.69%
Total Supply
21,000,000 BTC
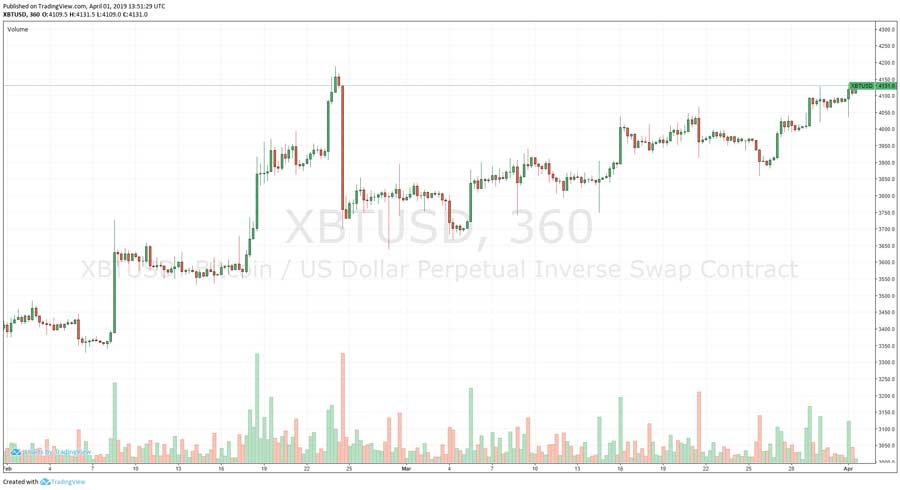
As we look at the bitcoin chart analysis of the last month’s price in bitcoin, it is extremely significant to know the obvious, in that exchange rates play a crucial role in currency trading.
However, some people may not fully understand how exchange rates work. Today, we’re explaining everything you need to know about how bitcoin exchange rates work and how the price of bitcoin is determined.
The bitcoin network has been running for nearly 4,000 days (December 17, 2019 to be exact) since the open-source peer to peer BTC blockchain software began.
A decade ago, one bitcoin was worth less than a penny. Today, one bitcoin is worth around $10,000 and has an all time high of just under $19,900 BTC/USD. Clearly, bitcoin’s exchange rate has fluctuated wildly over the years as the volatility has even saw not one, not two, but three different 80% drawbacks down from previous chart highs.
The most demanding questions we will supply answers to are the following:
How is an exchange rate like BTC/USD calculated?
What types of factors go into the exchange rate?
Why do exchange rates change?
What causes bitcoin’s exchange rate to fluctuate wildly with volatility?
What determines if bitcoin’s exchange rate goes up or down?
Who sets bitcoin’s exchange rate and its USD calculation?
Why are some fiat currency exchange rates fixed while others are floating?
what was the past history price of bitcoin from 2009 to 2019?
what are the bitcoin exchange rate value gains and losses month by month, year by year?
what are the most common questions about the price of bitcoin measured in USD value?
We hope the cryptocurrency community is ready for this one-of-a-kind bitcoin price guide.
Here is a simple bitcoin price to USD conversion calculator as well as an easy way to exchange BTC for USD.
Can’t load widget
What is an Exchange Rate? How Do BTC in USD Exchange Values Work?
Whether we’re talking about cryptocurrency exchange rates or fiat currency exchange rates, exchange rates all work in pretty much the same way.
An exchange rate is simply a way of expressing one currency’s value to another. It tells you how much your currency is worth in a foreign currency.
The current exchange rate between the United States Dollar (USD) and the Canadian Dollar (CAD), for example, is approximately $1 USD = $1.30 CAD. That means your 1 USD is equivalent to $1.30 CAD.
You can also express exchange rates the opposite way. You can say $1 CAD = $0.76 USD. If you are exchanging CAD for USD, then you will need to pay $1 CAD to receive $0.76 USD in return.
As of November 2019, the exchange rate between bitcoin and the USD is roughly 1 BTC = $9,400 USD.
To help you understand exchange rates, it may help to think of an exchange rate as the price you need to pay in your currency to purchase another currency. If the BTC/USD exchange rate is 10,000.00, for example, then it means it costs $10,000 USD to buy 1 BTC. The exchange rate always shows how much of the second currency (USD) you need to purchase one unit of the first currency (BTC).
How Exchange Rate Pairs Work
Sometimes, we also see exchange rates expressed as a pair. A currency pair is a price quote of the exchange rate for two different currencies traded in foreign exchange (forex) or cryptocurrency markets.
When an order is placed for a currency pair, the first listed currency or base currency is bought, while the second listed currency in the pair – the quote currency – is sold.
The EUR/USD currency pair is the most liquid currency pair in the world. With this pair, one party is selling EUR for USD, while the other party is buying EUR for USD.
Sometimes, currency pairs will be expressed like this: EUR/USD = 1.200. This means that you can sell the first currency (EUR) to receive the second currency (USD) in the listed amount. You can sell 1 EUR for $1.2 USD.
There are as many currency pairs as there are currencies in the world. From major currency pairs like the USD and JPY to smaller currency pairs like the North Macedonian Denar (MKD) and Albanian Lek (ALL), there’s no limit to the number of currencies you can buy and sell today.
Where Do Exchange Rates Come From?
Most foreign currencies and cryptocurrencies are traded 24 hours a day, 7 days a week. Over $5 trillion of fiat currency changes hands every day worldwide.
We look at these transactions to determine the current exchange rate. How much did someone just pay to buy the USD with BTC? How much did someone pay in CAD to buy USD?
With all currencies, prices change constantly. Mexican Pesos are being constantly traded with US Dollars, for example. Euros are being constantly exchanged for Russian Rubles. These currency transactions occur constantly, and these transactions determine the exchange rate.
Fixed Versus Floating Exchange Rates
Most major world currencies use a floating exchange rate. The exchange rate changes at any time due to supply and demand. Some countries, however, use fixed exchange rates. The exchange rates of these currencies cannot change. The rate is fixed or pegged to something.
Under a floating exchange rate, a limitless number of factors can influence exchange rates. When the United Kingdom voted to leave the European Union, for example, the value of the British Pound (GBP) fell relative to the Euro, US Dollar, and other major world currencies.
Exchange rates can be influenced by countless factors, which is why most exchange rates fluctuate throughout the day.
Certain countries, however, do not have floating exchange rates. They have fixed exchange rates. These countries will peg their currency to the US Dollar or a similarly stable currency, then maintain those rates over a long period of time.
The Saudi Arabian Riyal, for example, has a fixed exchange rate. It only changes in value when the government decides to change its value.
China, meanwhile, had a similar system for a long time with the Yuan. The value of the Yuan was kept artificially low against the US Dollar to make Chinese goods more attractive for exporters. Today, China has moved away from this system, although the Yuan is still not allowed to fully float. Instead, the Yuan is allowed to move within a small band.
Do Governments or Central Banks Control Exchange Rates?
Most major countries today use flexible or floating exchange rates. The United States government, for example, cannot directly change the exchange rate of the USD with other fiat currencies. The exchange rate floats on purpose.
Most central banks don’t directly change exchange rates. However, central banks may issue policies to indirectly impact exchange rates over the long term.
Central banks can adjust interest rates and impact inflation, for example, both of which can affect the exchange value of a currency against global currencies.
Some Governments Do Directly Control Exchange Rates
Most national governments do not directly interfere with exchange rates. However, governments in certain countries do directly impact exchange rates.
The Saudi Arabian Riyal, for example, rarely fluctuates against global currencies because the Saudi government uses a fixed exchange rate. This exchange rate only changes when the government decides to change it.
The Chinese Yuan, meanwhile, had a fixed exchange rate for decades, although the Chinese government is now transitioning to a flexible exchange rate. Today, the Yuan’s exchange rate changes less frequently than currencies with a flexible exchange rate, but it changes more frequently than currencies with a fixed exchange rate.
When a government maintains a fixed exchange rate, that exchange rate is usually pegged to the US Dollar. Some countries – like Singapore, for example – peg the value of their currency to a basket of assets, including the US Dollar and other major currencies or global assets.
What Affects a Currency’s Exchange Rate?
All currency exchange rates are influenced by supply and demand – including the exchange rate for bitcoin, the US Dollar, and other currencies.
How much are people willing to pay for one bitcoin? How many bitcoins are available? Based on the answers to these two questions, the price of bitcoin will rise or fall.
Of course, supply and demand are intricately linked to thousands of different factors.
in the traditional currency world, three factors influence the exchange rate:
Interest Rate: Most countries have a central bank that pays an interest rate. A higher interest rate makes the currency more valuable because investors want to invest in that country, taking advantage of high interest rates by switching their money to that country’s currency. Investors will exchange their currency for the currency that pays higher interest, then save it in that country’s bank to take advantage of those high rates.
Money Supply: Most central banks also control the money supply. The United States Bureau of Engraving and Printing, for example, prints 38 million notes a day with a face value of about $541 million. When more money is printed, it weakens the value of the money in circulation. There’s too much money chasing too few goods and services. People who hold money will bid up the prices of goods and services, creating inflation. If far too much money is printed, then we see hyperinflation – like what we saw in 1920s Germany or modern Zimbabwe.
Economic Growth and Financial Stability: A country with a strong, growing economy will attract investors. These investors will buy the country’s goods and services. They need to buy the country’s currency to do so, which causes the price of that currency to rise. Contrarily, if the country’s economic growth and financial stability weakens, investors will want to sell their assets, creating downward pressure on the currency and causing prices to fall.
All three of these factors have a significant impact on fiat currency prices. Next, we’ll take a look at how certain factors affect the price of bitcoin.
What Affects Crypto Exchange Rates?
All of the above factors play a crucial role in exchange rates in fiat currency markets. But what about crypto markets?
In crypto markets, exchange rates are primarily governed by the same two broad factors: supply and demand.
Supply: How many tokens are available to be purchased? How rapidly is supply growing every year? How many tokens are locked up? How many tokens are available through exchanges or in the hands of the public?
Demand: How much is someone willing to pay for each token? How badly do people want to buy a particular token? What types of attractive features does the currency have that no other currencies have?
When demand and supply are equal, a cryptocurrency’s value stays equal. When demand outpaces supply, meanwhile, prices rise. We’ve seen this with bitcoin over the last decade: bitcoin has a fixed supply of 21 million, with a declining number of tokens released periodically. As demand has risen for bitcoin, and supply has stayed the same, the price per bitcoin has inevitably risen.
Of course, supply and demand are made up of thousands of different factors themselves.
A cryptocurrency with a strong developer community, great app support, and lots of hype, for example, will have strong demand. Thousands of factors can influence demand.
How Does Bitcoin’s Exchange Rate Work?
Bitcoin’s exchange rate works in a different way than traditional national currencies.
Sure, bitcoin’s exchange rate is influenced by some of the same factors.
The money supply(or total supply) of bitcoin plays a role, for example, as does the inflation rate (emission rate or block reward) of bitcoin.
Unlike with national currencies, however, bitcoin’s exchange rate is not affected by any specific national economy. A country’s central bank cannot change its interest rate to influence the exchange rate of bitcoin, for example. There’s no bitcoin central bank that can choose to release more bitcoins.
Bitcoin’s exchange rate is also not really influenced by financial cycles. The quarterly GDP growth of a country doesn’t impact bitcoin, nor do the natural recessionary and inflationary cycles.
Up above, we talked about how two simple factors influence every currency exchange rate in the world: supply and demand. Just like fiat currencies, cryptocurrency exchange rates are influenced by thousands of subfactors that make up supply and demand.
Which Countries Have Fixed Exchange Rates? Are They Good or Bad?
Some believe that controlling an exchange rate is a good idea. Clearly, it worked out well for China and Saudi Arabia over the last few decades.
When most people hear about a fixed exchange rate, they think about the Chinese Yuan and Saudi Arabian Riyal.
You may be surprised to learn, however, that the United States and most major countries had a fixed exchange rate for most of the last century.
Throughout the 1800s and 1900s, the United States gradually accumulated most of the world’s supply of gold. The U.S. government fixed the price of gold at $20.67 an ounce with the Gold Standard Act of 1900.
That price would stay the same until 1934, when the Gold Reserve Act prohibited private ownership of gold and authorized President Franklin Delano Roosevelt to devalue the US Dollar. Overnight, the government increased the price of gold from $20.67 per ounce to $35 per ounce. The dollar was devalued by 60%, although the value of the government’s gold reserves increased in value from $.033 billion to $7.348 billion overnight.
Most other companies recognized the value of a stable currency, and the United States was rapidly becoming a global superpower. Thus, in 1944, most countries of the world signed the Bretton Woods Agreement, thereby agreeing to peg their currencies to the US Dollar.
This gold standard lasted all the way until 1971, when President Nixon removed the US Dollar from the gold standard. From this point forward, the US Dollar has maintained a floating or flexible exchange rate.
Pros and Cons of a Fixed Exchange Rate
Whether dealing with fiat currencies or cryptocurrencies, fixed exchange rates can be good or bad. Some of the pros and cons of a fixed exchange rate include:
Pros
Stability: The first and most important advantage of a fixed exchange rate is that it can create stability. Investors know what a currency is worth. They can invest in a country and know that the investment isn’t going to wildly fluctuate because of currency valuation.
Smaller Countries Benefit from the Strength of Stronger Countries: More countries peg their currency to the US Dollar than any other currency in the world. Why? Well, the United States has a strong and diversified economy. When the US Dollar grows, any country that uses the US Dollar can indirectly benefit from that growth. If your fiat currency is pegged to the US Dollar, and the US Dollar rises in value, then your fiat currency also rises in value.
Cons
Fixed Exchange Rates Are Expensive to Maintain: Most governments maintain a fixed exchange rate by maintaining large foreign currency reserves. For a country as large as China, vast foreign currency reserves are needed to keep the currency stable. These reserves are costly to maintain.
Makes a Country a Target for Speculators: Fixing an exchange rate can make a country a target for speculators. Speculators can short the currency, artificially driving down the value of the currency. The central bank must convert its foreign exchange to prop up its currency’s value. If the central bank doesn’t have enough, then it will have to raise interest rates, causing a recession. We saw this with the British Pound in 1992, when George Soros kept shorting the pound until the UK’s central bank gave up and allowed the pound to float. We also saw it with Switzerland in 2015, when the government released the Swiss Franc from its peg to the Euro.
Black Markets Can Subvert Fixed Exchange Rates: Governments often try to implement a fixed exchange rate to enjoy the advantages listed above, only to fail with the actual implementation of that fixed exchange rate. We’ve seen this occur in Venezuela and other countries. The government of Venezuela has officially pegged its currency to the US Dollar to regain economic stability. However, most citizens are privately willing to accept a much different exchange rate through black markets. The black market exchange rate is much different from the official exchange rate, undermining the government’s attempt to create stability.
Fixed Exchange Rates in Crypto
We see fixed exchange rates in the crypto world. They’re most often seen with stablecoins.
Stablecoins are cryptocurrencies that have a deliberately stable value. The vast majority of stablecoins on the market today are pegged to the US Dollar. They maintain their stable value by holding 1:1 US Dollar cash reserves.
Stablecoins like the Gemini Dollar (GUSD) and Tether (USDT) work in this way: these companies release digital tokens 1:1 with their cash reserves. GUSD and USDT token holders can exchange these tokens at any time for US Dollars. As long as you can exchange 1 GUSD for 1 USD, then 1 GUSD will always be worth 1 USD on the market.
Some Countries Use Loosely Fixed Exchange Rates
Some countries have created a unique solution. They have created loose exchange rates. These exchange rates have a certain trading band. The exchange rate is allowed to float within this band.
The goal of a loosely fixed exchange rate is to give the currency the adaptability of a floating exchange rate combined with the stability of a fixed exchange rate. When properly implemented, it can work quite well.
There are three major fiat currencies that currently use loosely fixed exchange rates:
China: The Chinese Yuan (CNY) has a 2% trading band based around yesterday’s midpoint. The exchange rate is allowed to float within this band before the government takes action to stabilize the exchange rate. The Yuan is fixed to a basket of assets (which mostly consist of US Dollars).
Singapore: The Singapore Dollar (SGD) is managed within a trading band to allow a slow rise in value. It’s fixed to a basket of assets.
Vietnam: The Vietnamese Dong (VND) has a 2% trading band, although the government periodically devalues the currency beyond this range (as occurred in December 2016). The Dong is pegged to the US Dollar.
Cryptocurrency Exchange Rates Cannot Be Influenced by Central Banks
Central banks and other government entities have some influence over fiat currency exchange rates. The US Federal Reserve can adjust interest rates, for example, to indirectly impact exchange rates.
One of the biggest advantages of cryptocurrency is that exchange rates lie outside the domain of government decision-making.
Bitcoin is the world’s first truly global currency. It’s not tied to the economic performance of any single country. A central bank cannot singlehandedly impact the price of bitcoin.
If the US economy goes into a recession, then the value of the US Dollar is expected to drop. The value of bitcoin, meanwhile, may not change relative to other global currencies, because bitcoin isn’t just linked to the US economy.
Crypto Exchange Rates Aren’t Immune from Government Intervention
Of course, even the most hardcore cryptocurrency advocates will admit there’s a flaw with cryptocurrencies: governments can still impact cryptocurrency exchange rates in multiple ways.
Governments Can Hold a Crypto Reserve Fund: Let’s say the United States government wants to control the BTC/USD exchange rate. They decide to buy 1 million BTC and hold it in a reserve fund. If the BTC/USD exchange rate starts getting too high, the US government sells some of this fund, creating selling pressure on markets and causing prices to drop.
Governments Can Ban or Restrict Crypto: The Chinese government banned many aspects of crypto trading in 2017. This caused bitcoin prices to plummet, although the effect was short-lived. Many people saw this as a positive sign: even a country as large and powerful as China cannot singlehandedly influence bitcoin’s value long-term. However, think of what would happen if multiple countries banned bitcoin overnight. What would happen if the EU suddenly changed the way it treated bitcoin? What happens if the US government decides to ban bitcoin?
Because of these two drawbacks, governments can still influence crypto exchange rates in various ways.
Overall, however, cryptocurrency exchange rates are largely dictated by two market forces: supply and demand. Cryptocurrency exchange rates aren’t fixed to any specific government, nor are they pegged to a specific value or fiat currency. This is one enormous difference between cryptocurrency and fiat currency exchange rates.
Exchange Rates and Conversion Spreads
In cryptocurrency and fiat currency markets, there’s never just one specific cryptocurrency exchange rate.
Sure, the BTC/USD exchange rate could be around 10,000.00, but you’re unlikely to see that exact exchange rate from every exchange and bank.
When there’s a difference between exchange rates, it’s called the conversion spread. The conversion spread is different from the market price that a trader will get.
A bank, currency exchange, or cryptocurrency exchange will markup the price so they make a profit. Credit cards, PayPal, and other money services operate in the same way.
Let’s say the USD/CAD exchange rate is 1.30. You might travel to the United States and buy a case of beer using your CAD credit card for $10 USD. If you paid a market rate, then your total charge would be $13 CAD. In reality, however, your credit card company will charge an additional exchange rate of, say, 2.5%. The price you see on your credit card will be $13.25 CAD because of this added fee.
Banks, currency exchanges, and cryptocurrency platforms charge conversion spreads to cover their service fees. Some charge additional fees on top of this, while others – like credit card companies – only charge foreign exchange fees.
Next, we’ll talk about the specific factors that influence the price of bitcoin, but first we have a very special chart to show you of the month by month breakdown of the bitcoin price action.
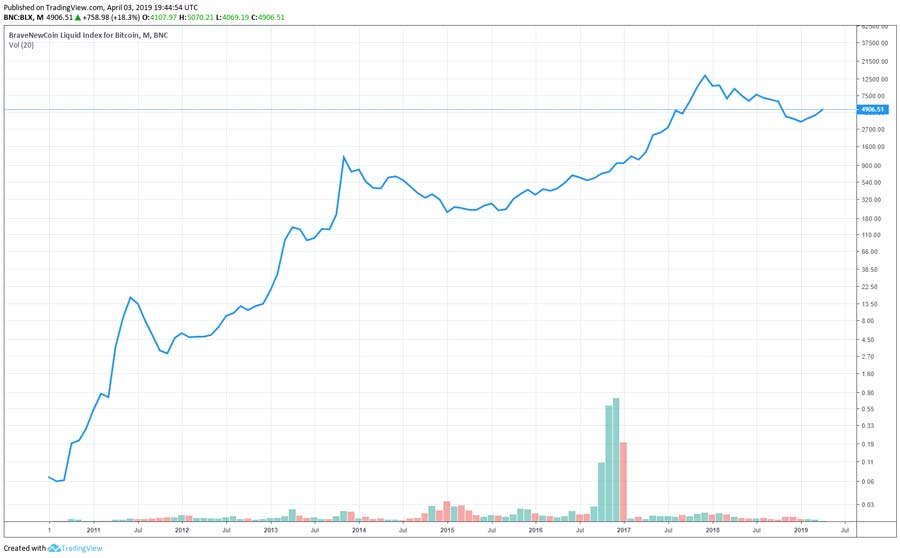
BTC Price Chart Gains/Losses Month by Month, Year by Year
Click to Enlarge: 2009-2019 Month by Month Bitcoin Price Chart Showing Gains and Losses
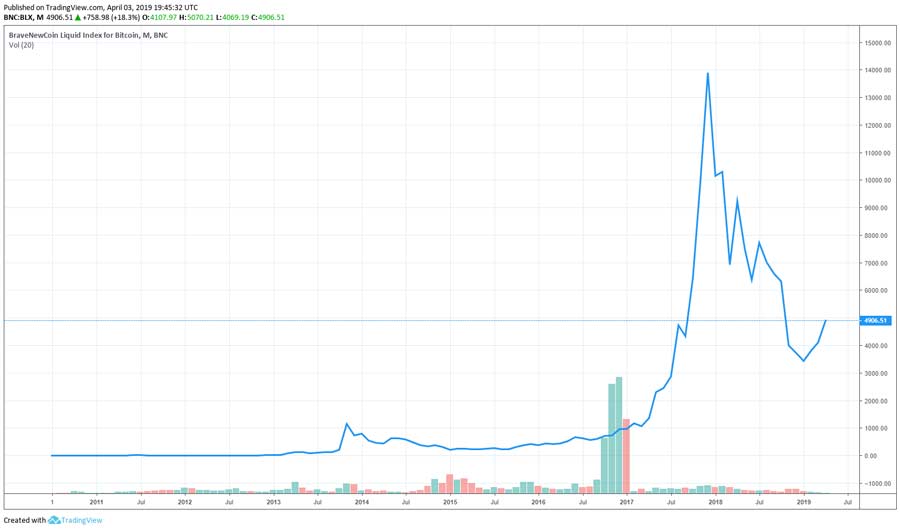
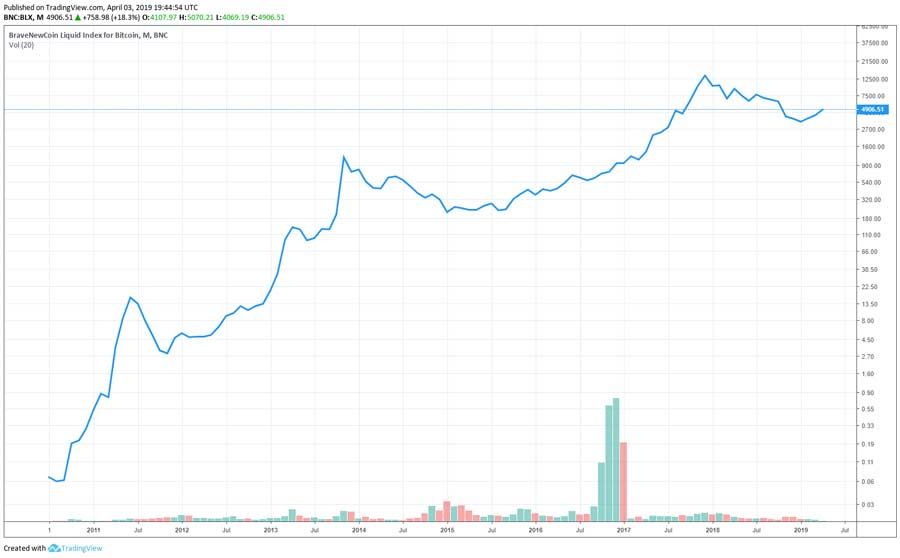
Now, here is an extra sweet graphic made illustrating every month of Bitcoin’s price gains and losses, as well as a review summary of what all of these numbers represent.
Most people look at bitcoin’s price as a continuous chart. Bitcoin is traded 24 hours a day, 7 days a week, all over the world. It doesn’t follow traditional financial market cycles. There are no quarterly bitcoin profit reports.
However, you can still glean certain information from how bitcoin moves in each month. Here’s a chart of bitcoin’s price movements every month from August 2010 (the launch of the first bitcoin exchange rate tracker) all the way to October 2019.
The data was compiled by Cane Island Alternative Advisors, a Texas-based crypto analysis firm, with data collected from Coinmetrics.
The chart looks like a bit of a mess, with few discernable patterns. However, here’s some of the information we can get from the chart:
Bitcoin had its best month in November 2013, when prices rose 467.4% between November 1 and 30
On average, bitcoin experiences its biggest positive price movements in April (32.4% average) and May (28.9% average), which is significantly higher than any other month
August and September are the only months where bitcoin had a negative average price movement, with drops of 37.3% and 48.3%, respectively
October and November have the next biggest average price jumps after May and June, with jumps of 20.1% in October and 26.9% in November, on average
In total, bitcoin has gained 1146.1% cumulatively in the months of May between 2011 and 2019, which is a higher cumulative rise than any other month
Bitcoin has experienced similarly impressive cumulative price rises in all months of May (885.6%), November (752.6%), and October (523.3%)
Bitcoin’s biggest ever year-long price jump occurred in 2013, when bitcoin’s price rose 5486.7% from January 1 to December 31
Bitcoin has only had two negative years: in 2014, bitcoin’s price dropped -57.6% from the start to end of the year; and in 2018, bitcoin’s price dropped -70% from the start to end of the year
Bitcoin has had two months where its price remained perfectly neutral, changing 0.0% on average from the first to last date of the month: September 2010 and April 2012
Bitcoin’s worst month in history was August 2011, when bitcoin dropped -39.4% from the first to last date of the month
Bitcoin’s second and third worst months, interestingly, occurred immediately after its worth month: bitcoin dropped 37.3% in September 2011 and 36.4% in October 2011
Now, let’s transition into the top 20 driving forces responsible for moving the price of bitcoin up and down.
Top 20 Factors Influencing the Price of Bitcoin
Thousands of individual factors influence the price of bitcoin. We’ve outlined the top 20 factors below.
Maximum Supply of Bitcoin
Bitcoin is the only major currency in the world with a specific, predetermined, fixed limit. There will only ever be 21 million bitcoins in existence. This limit is hardcoded into bitcoin.
The actual supply of bitcoin, of course, is already much less than that. Millions of bitcoin have been lost, locked away, or destroyed. Some people believe as many as 4 million bitcoins are no longer accessible.
Out of the 18 million bitcoins mined to date, it could mean that only 12 or 13 million are actually circulating, and only another 3 million remain to be printed over the next 120 years (the last bitcoin is scheduled to be mined in 2140).
Emission Rate (Block Reward)
Just like a central bank, the bitcoin blockchain prints new money every year. Every 10 minutes, the bitcoin blockchain releases 12.5 BTC into the economy. This is the block reward, and it’s given to the bitcoin miner who mined that block.
It helps to think of the emission rate as the inflation rate of bitcoin. As new bitcoins are minted, it should drop the price of bitcoin (assuming demand remains steady), causing inflation. However, the emission rate of bitcoin is so low that it does not keep up with rising demand. That’s why the price of bitcoin has continued rising year after year.
Bitcoin’s emission rate drops periodically. Initially, the bitcoin blockchain gave out 50 BTC as a block reward. Then, that number dropped to 25 BTC. Today, it sits at 12.5 BTC, with another block reward ‘halving’ scheduled to occur on May 14, 2020. On this date, bitcoin’s block reward will drop to 6.25 BTC, which means bitcoin’s inflation rate essentially gets cut in half overnight.
The Dwindling Supply of Bitcoin
It’s not just the supply of bitcoin that’s a factor, but it’s also the fact that the supply of new bitcoins is dropping. We’ve mined 18 million bitcoins to date (as of November 2019). There are just 21 million bitcoins that will ever be produced, which means we’ve mined 85% of the total supply of bitcoin.
What’s even more surprising is that we won’t mine the last bitcoin until the year 2140!
Due to bitcoin’s dwindling block reward system, bitcoin’s block reward will continue getting cut in half until just a few tenths or hundredths of a bitcoin are being mined every day.
Finally, in the year 2140, the bitcoin blockchain will have mined the last bitcoin, at which point no new bitcoins will ever be created.
Economic Growth in the Bitcoin Community
Bitcoin isn’t tied to the economic growth of any specific country. However, there’s still an entire bitcoin economy out there. This bitcoin economy doesn’t work quite like the economy of the United States or China.
However, bitcoin’s economy is still impacted by things like consumer spending. How often are people actually using bitcoin to spend? How often are people making transactions in bitcoin? What kinds of goods or services is someone willing to provide for 0.5 BTC?
Bitcoin’s economy is also influenced by its community support and development. Are developers contributing to the project? Are community members supporting bitcoin apps?
Bitcoin’s community has its own economy, and as that economy grows, it influences demand for bitcoin.
Available Supply of Bitcoin
This is the third time we’ve mentioned supply as one of the factors influencing the price of bitcoin. The available supply of bitcoin, however, can be significantly different than the actual circulating supply.
We know that 18 million bitcoins have been mined to date. However, we also know that not all 18 million of those bitcoins are still circulating.
A certain number of bitcoins are being held by people who will never sell them below a certain price, for example. A certain number of bitcoins have also been lost or destroyed over the years and will never be recovered.
With these factors in mind, the formula for calculating the available supply of bitcoin looks like this:
Available Supply = Circulating Supply – Bitcoins that Are Being Held or Lost
We know there are 18 million bitcoins in existence. Now, let’s assume that two million of those bitcoins have been lost. People throw out hard drives. People forget their passwords. People accidentally destroy or wipe out old computers. Because of these lost or destroyed bitcoins, we have only 16 million bitcoins in circulation.
Now, let’s assume that of the remaining 16 million bitcoins held by people, 15 million of them would never sell their bitcoins for anything less than $20,000 apiece.
In this scenario, the available supply of bitcoin at any price underneath $20,000 would be 1 million BTC.
This plays a crucial role in the price formation of bitcoin. Let’s assume we have a bunch of buyers who want to invest in bitcoin. They want to buy 10,000 BTC regardless of the price. These buyers hit the market, targeting the 1 million bitcoin holders willing to sell for a price below $20,000. Eventually, the sellers dwindle, and the price gets pushed upward. Eventually, the price gets pushed high enough that it may break $20,000, which is the point at which certain people are willing to sell their bitcoin.
Ultimately, this phenomenon of prices rising and falling creates a back and forth dance. Buy and sell volume continues fluctuating endlessly, creating volatility in the markets until prices settle.
Apps and Software Development
Bitcoin is open source, and anyone can build anything on bitcoin. As bitcoin’s usage has increased, so too has the demand for apps and software to enhance the usability of bitcoin.
App and software developers face a catch-22 situation with bitcoin. As demand for bitcoin increases, the demand for good bitcoin apps and software also increases. But for app and software developers to build on bitcoin, they first need to see some demand for their apps and software.
Despite this catch-22 situation, app and software developers continue to build great things on bitcoin. Some software interacts directly with the bitcoin ecosystem: wallet apps let you securely hold bitcoin on your mobile device, for example.
Other software doesn’t directly connect to the bitcoin blockchain in any way. A portfolio tracker app, for example, simply checks the price of bitcoin and tells you how valuable your portfolio is.
As more apps and software are built on bitcoin, it enhances demand for bitcoin. It makes bitcoin easier to use. You start using bitcoin. You try to get your friends to start using bitcoin. There’s less effort required to participate it bitcoin. There’s less of a learning curve. With fewer barriers to entry, there’s never been a better time to enter.
Accessibility and Ease of Purchase
In the early days of bitcoin, it was relatively hard to use bitcoin. You needed to download the full bitcoin software just to hold bitcoin, for example.
Today, buying bitcoin is as easy as downloading a mobile app and inputting your credit card information. Some people can buy bitcoin from their ordinary investment platforms – like Robinhood, Fidelity, or TD Ameritrade.
As bitcoin’s ease of use increases, it becomes increasingly accessible to a wider group of people. In 2011, someone might have heard about bitcoin and been interested in buying bitcoin but was dissuaded by the high learning curve and complicated purchasing process. Today, that same person faces few hurdles on her way to purchasing her first bitcoin.
Competition from Altcoins and Banks
Back in 2009 when bitcoin first launched, it had no competition. It was the only blockchain-based, cryptographically-secured currency in the world. People didn’t even know what blockchain was.
Today, things have changed, and bitcoin has plenty of competition. Bitcoin’s competitors are faster and more scalable. Some of them are more anonymous or privacy-focused.
One thing, however, has remained constant throughout crypto history: bitcoin has remained the world’s largest cryptocurrency by market cap. From 2009 to 2017, bitcoin’s dominance sat somewhere between 90% and 100%. That means out of all the money in crypto, 90% to 100% of that money was in bitcoin.
From 2017, things have changed. In January 2018, bitcoin’s dominance reached an all time low of around 36%. More money was in competing altcoin markets than in bitcoin.
Today, bitcoin’s dominance has once again risen. As of November 2019, the BTC dominance index sits at around 70%.
Of course, things can easily change in the future. Bitcoin had the first mover advantage, but it faces competition from some of the world’s elite development teams. There are faster and better cryptocurrencies on the market, but none of these competitors have challenged bitcoin’s dominance as of yet.
Plus, bitcoin is facing competition from more than just altcoins. Banks are making their own free money transfer services – like Venmo. Corporations are also launching their own digital currencies – like Facebook’s Libra, which is backed. All of these may be competition for bitcoin.
Cost of Production
Cost of production plays a crucial role in the price of bitcoin. Yes, bitcoin is a virtual currency, and there’s no physical ‘bitcoin’ that needs to be manufactured. However, there are still real production costs involved in bitcoin, including mining and electricity consumption.
Mining bitcoin requires the use of enormous amounts of energy to power server farms. These server farms work to create a cryptographic solution. The first computer to find that solution receives the block reward.
As more miners join the bitcoin ecosystem, it becomes harder and harder to mine bitcoin. Difficulty increases, which means it takes more electricity and computing power to solve each cryptographic puzzle.
Theoretically, there doesn’t have to be a connection between bitcoin’s market price and its mining costs. In practice, however, we find that bitcoin’s price is closely related to its marginal cost of production.
Regulatory and Legal Issues
It’s true that individual governments do not have full control over bitcoin. However, it’s also true that individual governments can issue regulations that significantly impact bitcoin.
We saw this in September 2017 when China banned bitcoin exchanges from operating in the country. Bitcoin’s price plummeted (although it later rebounded to its all time high by the end of the year).
We’ve also seen this in New York, which was the first state to introduce crypto-specific regulations that exchanges need to follow. Today, many crypto exchanges continue to ban New York residents from participating in the exchange because these exchanges don’t want to abide by BitLicense requirements.
What happens if the IRS suddenly decides that bitcoin is non-taxable? What happens if the United States government bans the purchase of bitcoin tomorrow? What happens if the European Union issues regulations strictly prohibiting the use of cryptocurrency exchanges?
All of these situations are feasible. Some regulations will cause the price of bitcoin to plummet, while others will cause the price to rise or stay the same. But clearly, regulatory and legal changes have a significant impact on the price of bitcoin.
Availability on Local and International Exchanges
The world’s largest cryptocurrency exchanges accept popular fiat currencies like the US Dollar and Euro. However, most cryptocurrency exchanges do not accept smaller fiat currencies. Most cryptocurrency exchanges do not have an AUD/BTC pair, for example, or a CAD/BTC pair. Instead, Australians and Canadians need to go to special exchanges to trade their Australian or Canadian Dollars for bitcoin.
As bitcoin becomes more available on global exchanges, it becomes easier for people around the world to purchase. Some of the biggest opportunities for bitcoin to grow are in developing parts of the world: over 2 billion people worldwide are underserved by traditional banks but could benefit significantly from bitcoin.
Every time a crypto exchange opens in a new, underserved part of the world, it increases the availability of bitcoin, lowering barriers to entry and addressing increasing demand.
Media Coverage
Media coverage of bitcoin has a huge influence on demand for bitcoin, so it’s not surprising that media can significantly influence the price of bitcoin.
Positive media attention can cause bitcoin prices to skyrocket. Suddenly, it seems like everyone is talking about bitcoin in a favorable light and sees it as the new digital gold.
Meanwhile, negative media attention can cause demand for bitcoin to plummet. Major media outlets may call bitcoin a scam or a pyramid scheme, for example, convincing users to sell their bitcoin and causes prices to plummet.
Forks and Development Milestones
Bitcoin has undergone several major forks in its history, including soft forks and hard forks. The biggest hard fork to date, however, occurred on August 1, 2017, when bitcoin split into bitcoin (BTC) and Bitcoin Cash (BCH).
When forks or major development milestones occur, it can send ripples through markets. Bitcoin’s price fluctuated wildly in the days leading up to the hard fork. Although markets may not fully understand how these hard forks work or what their ultimate impact will be, it’s obvious that these hard forks have a significant impact on supply and demand.
Internal Governance
Bitcoin has no board of governors. There’s no centralized corporation in charge of bitcoin’s decisions. Bitcoin’s governance is decentralized.
However, there are still, by necessity, central figures behind bitcoin’s governance. There are lead bitcoin developers responsible for bitcoin’s biggest changes. There are people who own certain domains – like bitcoin.com or bitcoin.org – who can influence communities.
Inevitably, there are disputes within this governance structure. Sometimes, these disputes are resolved without issue. In other cases, they lead to hard forks. When internal governance problems strike bitcoin, it can affect market supply and demand.
Security Issues, Hacks, and Data Breaches
There have been hundreds of crypto exchange hacks, security breaches, data losses, and other issues over the years. When these breaches occur, it can send shockwaves through the market.
If an exchange gets hacked and loses $100 million of customer funds, for example, then it can cause panic in the marketplace. People might try to sell their bitcoin and withdraw their funds quickly, for example.
Or, if someone’s personal information, private keys, or other data gets leaked, then it can cause a similar panic. Security issues can create downward selling pressure on the market.
At the same time, new advancements in security can give the market greater peace of mind. A new, affordable wallet can give people peace of mind that their funds are safe in bitcoin, for example, creating upward pressure on markets.
Bitcoin Scams and Pyramid Schemes
We’ve all heard the stories of effortless crypto millionaires: people who bought huge amounts of bitcoin at the right time, then held onto that bitcoin until it was worth millions of dollars. We’d all like to make easy money, which is why scammers often target new bitcoin users with get rich quick schemes.
There have been plenty of scams in bitcoin’s history – from exit scams to pyramid schemes to fraudulent investment programs. When a bitcoin scam is uncovered or shut down, it casts all of bitcoin in a negative light, which can significantly impact the price of bitcoin.
Events
All types of events can impact the price of bitcoin, including:
The shutdown of major marketplaces that use bitcoin (like the infamous drug marketplace Silk Road)
The announcement of government regulations
An exchange hack or security breach
Announcement of tax changes
Global recessions or major economic events
Hard forks
A whale moving a large number of coins to the market
A wallet untouched since the early 2010s suddenly moving huge numbers of bitcoins
The launch of a competing cryptocurrency
Political events, like the election of a crypto-friendly president
All of these events can have varying effects on the price of bitcoin.
The Launch of New Computing Technology or Miners
Bitcoin mining is all about mining the most bitcoin with the fewest resources. With that goal in mind, miner manufacturers like Bitmain have created highly-specialized computers dedicated solely to mining bitcoin. These highly-efficient machines produced the highest possible hashrate with the least amount of electricity.
As technology grows, miners become more and more efficient. In the early days of bitcoin, you could mine bitcoin with an average gaming PC graphics card. Today, you can barely make a profit even with specialized miners.
The launch of new computing technology affects miners’ profits significantly, and that can impact the price of bitcoin.
In the future, we may have to deal with the launch of quantum computers. Quantum computers will be able to blast today’s computers out of the water. Some believe this will instantly cause the destruction of the bitcoin network. Others believe we can avoid this was quantum-resistant upgrades.
The Intrinsic Value of Bitcoin’s Software and Blockchain
Crypto critics will often claim that bitcoin has “no intrinsic value”. There’s nothing backing bitcoin, so how can it be worth anything over the long term?
In reality, most modern fiat currencies aren’t technically backed by anything either. No major currency is on the gold standard, for example. Some modern economies – like Canada – don’t even own significant amounts of gold anymore. Instead, these fiat currencies get their value ‘by decree’ of the government. They have value because you trust the government of the United States or Canada.
Similarly, bitcoin’s intrinsic value comes from its underlying software, which is the bitcoin blockchain. Bitcoin’s blockchain is a technological innovation that solved crucial issues with digital money. It solved the double spend issue, for example, and the Byzantine Generals’ Problem. Because of the bitcoin blockchain, we have a secure version of digital money that runs without a centralized entity and cannot be hacked. That’s the value of bitcoin.
How People Use Bitcoin and See Bitcoin as a Currency
There’s considerable debate within the bitcoin community over how bitcoin should be used. Some people believe bitcoin should be used exclusively as a store of value: we don’t hand over chunks of gold to buy our morning cup of coffee, so why should we treat bitcoin differently?
Others believe that bitcoin should be used as a means of exchange. It should be used for daily purchases.
The issue comes down to the three properties of a currency. A currency, by definition, should serve three basic functions:
Means of Exchange: The currency should be used as a way to exchange goods and services. The value of the currency will be based off the value of the goods and services people are willing to give in exchange for the currency.
Store of Value: A currency must retain its value when stored. If you temporarily hold an asset and it loses a significant amount of its value, then it’s not a very good currency.
Unit of Measurement: The currency needs to function as a unit of measurement. Someone can say that a gallon of milk costs $4 today, for example. The currency is used to track the value of goods or services. If a gallon of milk costs $4 today and $300 tomorrow, then the dollar will no longer be used as a unit of measurement, and it won’t be considered a good currency.
Does bitcoin fulfill the definition a currency as listed above? Based on your opinion, this can significantly affect the value of bitcoin. Let’s take a closer look at how bitcoin functions for each of the purposes above:
Bitcoin as a Means of Exchange: Some people believe bitcoin should be used as a means of exchange. You should be able to use bitcoin at Starbucks, for example, or to buy a new car. A growing number of businesses and merchants worldwide now accept bitcoin as payment. As scaling technology improves, it’s becoming easier for bitcoin to be accepted globally as a means of exchange.
Bitcoin as a Store of Value: Bitcoin is most controversial when used as a store of value. You might buy 1 BTC for $10,000 today. Within a year, it’s not unreasonable to think that 1 BTC is worth anywhere from $2,000 to $30,000. Does that really make bitcoin a good store of value? Typically, stores of value are stable. Prices can go up or down, but the asset holds its value. Of course, you can also argue that bitcoin is the best store of value because it’s insulated from central banks, politicians, national economies, and similar things – all of which can affect fiat currencies.
Bitcoin as a Unit of Measurement: Bitcoin is worst when used as a unit of measurement. If you tell someone your gallon of milk costs 0.0005 BTC, they’ll have no idea what you’re talking about. Even crypto enthusiasts don’t use bitcoin as a unit of measurement. We constantly talk about bitcoin in relation to US Dollars. We enthuse when the price of bitcoin eclipses $20,000 USD, for example.
The three factors above all impact bitcoin’s strength as a currency. As bitcoin’s strength as a currency increases, we can naturally assume that its value rises.
Now let’s reverse gears and talk about the history of bitcoin and its price in USD.
Bitcoin Price History: Year by Year Timeline Overview
Anyone studying the price of Bitcoin will want to know how the bitcoin exchange rate has changed over time. And we brought it allllllll the way back, from January 3, 2009 to November 2019, this is the most comprehensive list of month by month and year by year bitcoin price action watch compilation.
In this section of our bitcoin price guide, it has 2 mini-big sections:
a) yearly bitcoin price history overview 2009-2019
b) historical bitcoin price timeline chart with dated news summaries
Most fiat currencies don’t jump in value from $0.10 to $20,000 in less than a decade. But bitcoin did. After launching on January 3, 2009, bitcoin eventually rose to reach parity with the US Dollar. Then, the price of bitcoin kept doubling.
Here’s a brief history of some of the biggest moments in bitcoin’s price and exchange rate:
January 3, 2009: The Launch of Bitcoin
On January 3, 2009, Satoshi Nakamoto mined the Genesis Block, which is the very first block in the bitcoin blockchain. Bitcoin has been running ever since. By January 9, Satoshi had released the first version of bitcoin’s software. Before the end of the month, Satoshi had sent one of the earliest bitcoin developers, Hal Finney, 10 bitcoins, marking the world’s first bitcoin transaction. It was the start of a whole new digital economy.
October 2009: The First Bitcoin Exchange Rate
In the early days of bitcoin, nobody really considered exchange rates. Bitcoin was a software program that worked in a unique way, but could you really put a set value on it? That’s exactly what happened in October 2009 when the New Liberty Standard published the first bitcoin exchange rate, which was $1 USD = 1,309.03 BTC. By December 2009, Satoshi and the small team of bitcoin developers had released the second version of bitcoin’s software.
May 2010: The First Real-World Bitcoin Purchase
Bitcoin hit a major milestone in May 2010, when someone actually exchanged some bitcoin for a real-world product. Florida-based programmer Laszlo Hanyecz sent 10,000 BTC to a man in London. Then, the man in London bought two pizzas over the internet and had them delivered to Hanyecz’s house. The two pizzas were worth $25, while bitcoins were still valued at a fraction of a penny. Today, making the same transaction would cost over $93 million.
July 2010: Bitcoin Crosses the Penny Mark
For bitcoin’s entire history up to this point, one bitcoin was worth a fraction of a penny. In July 2010, however, bitcoin crossed the $0.01 threshold for the very first time.
November 2010: Bitcoin’s Market Cap Surpasses $1 Million
2010 was a huge year for bitcoin. Bitcoin Market, the first crypto exchange, launched in February, while the much better-known Mt. Gox launched in July. Slush, the world’s first mining pool, mined bitcoin successfully for the first time. By November, all of the positive news had added up to serious results, as bitcoin’s market cap passed $1 million for the first time.
February 2011: Bitcoin Reaches Parity with the USD, Crosses $1 Threshold
Bitcoin reached parity with the US Dollar in February 2011, crossing the $1 threshold and hitting a major milestone. This was when bitcoin started to receive both good and bad press. Major media outlets published articles linking bitcoin’s rise to the success of the popular Silk Road darknet marketplace, for example.
June 2011: Bitcoin Rises Above $30, Then Sinks to $10
For bitcoin, any publicity was good publicity. The media attention towards bitcoin got people talking. Bitcoin’s price was pushed above $30 for the first time in its history, although it later crashed down below $10. Late in June, Mt. Gox also dealt with a serious security breach that compromised thousands of user accounts and their bitcoins.
April 2012: Bitcoin Crosses the $100 Threshold
Bitcoin started to sail smoothly in 2012, cruising to an all time high above $100 in April. New competitors like Litecoin, launched in late 2011, started to emerge, taking advantage of bitcoin’s open source technology to launch new and improved versions.
2013: Bitcoin Passes $1,000
Bitcoin’s price surged throughout 2012 all the way up to 2013, when it crossed the $1,000 mark for the first time. Bitcoin’s market cap also reached an all time high of $1 billion.
2014 to 2016: Bitcoin’s First Major Bear Market
Bitcoin had been through small bear and bull runs before. But the bear market that gripped bitcoin from late 2013 to early 2017 was the worst in bitcoin’s history to date. In January 2014, bitcoin fell below $1,000 and would not break the $1,000 mark again for two years. During this time, Mt. Gox went bankrupt and shut down, which was a problem because Mt. Gox was handling 70% of the world’s bitcoin trading volume. Many thought bitcoin was doomed. Bitcoin bottomed out below $500.
2017: Bitcoin Rises to Its All Time High of $20,000
In 2017, bitcoin’s bear market broke in a sudden and dramatic way. In early 2017, bitcoin smashed through the $1,000 mark – then didn’t stop. It kept rising past $2,000 and $3,0000 and $4,000, breaking each barrier in rapid succession. Bitcoin’s price hit a bump in August with the Bitcoin Cash hard fork, then it hit another bump in September when the Chinese government banned crypto exchanges. By the end of the year, however, bitcoin had officially become a household term. Bitcoin reached an all time high just shy of $20,000 in mid-December 2017.
January 2018: Bitcoin Falls While Altcoins Rise
A rising tide lifts all boats, and that’s what happened with bitcoin and altcoin prices in 2017. As bitcoin’s price rose, altcoin prices rose with it. In January 2018, however, it was the time for altcoins to shine. Bitcoin’s price plummeted to end 2017, then fell again to start January 2018. As bitcoin’s price fell, however, altcoin prices rose. Eventually, bitcoin’s dominance fell all the way to 36%, which was an all time low.
2018: Bitcoin’s Second Major Bear Market
Bitcoin spent most of 2018 gripped in ‘crypto winter’. Bitcoin prices fell, then altcoin prices fell, then both prices fell some more. The price of bitcoin hit multiple false bottoms. There were bear traps and bull traps. It was a messy, turbulent fall from grace for the world’s largest cryptocurrency. Eventually, the price of bitcoin settled into the $5,000 to $7,000 range.
2019: Bitcoin Slowly Shows Signs of Rebounding
At the start of 2019, bitcoin continued to be gripped in its bear market, although it would slowly show signs of rebounding. The much-anticipated launch of Bakkt occurred in fall 2019, making it easier for institutions to participate in crypto markets. Major exchanges like Coinbase and Gemini launched their own crypto custody solutions. All of the positive news pushed the price of bitcoin higher and higher. By the end of October 2019, bitcoin was sitting at a price of around $9,000 to $9,500. Unlike the dramatic rise of bitcoin in 2017, the 2019 rise of bitcoin has been slow and steady instead of sudden and dramatic.
Ok, now for part two of the bitcoin price history section, a very detailed catalogue of all the major news events that effected the price of Bitcoin, along with their BTC/USD exchange rate values attached. You will not find another 2009-2019 bitcoin price listing on the Internet as comprehensive as this one.
Historical Bitcoin Price Timeline of Events with News Dates
Bitcoin Price (BTC in USD) Values in 2019
$5,599 = April 23, 2019: BTC Reaches A Five-Month Peak
Towards the end of April, Bitcoin continued to rise, pushing to a high of $5,598. In doing so, this was the first time that Bitcoin had pushed over the $5,500 price level since November 2018, reached a high price point for the last five months.
$5,412 = April 10, 2019: BTC Pushed Past the $5,000 Price Level
Bitcoin started rising in price towards the beginning of April completely unexpectedly, quickly moving above $4,200 and through the $5,000 level as well within just 48 hours. From the start of the month, Bitcoin had gained over $1,200.
$4,152 = March 31, 2019: BTC Ended March Above $4,000 Price Level
Despite having a slow start to the year, Bitcoin spent the month of March with a hot streak. At just above $4,100, this month brought in a solid gain for the asset.
$3,867 = February 28, 2019: BTC Kept Up A 10% Incremental Rise, Month-Over-Month
Bitcoin began the month under $3,500, but it rose over 10% higher than it started, closing at $3,867 by the end of February.
$3,461 = January 31, 2019: CBOE BTC ETF Proposal Officially Withdrawn Before Resubmission
The proposal for a Bitcoin ETF with VanEck and SolidX was withdrawn by CBOE, due to worries that the government shutdown would end up causing the cancellation of the ETF anyway. The proposal was resubmitted by January 31, though there are some experts that believe that the proposal with the best chance of approval by the government as the original Bitcoin ETF with VanEck/SolidX proposal for the SEC.
$3,773 = January 1, 2019: Bitcoin Started the Year at Under $4,000
Bitcoin’s price for 2019 started at $3,773, holding a total market cap of $66 billion. However, by the end of the month, Bitcoin’s price fell down to $3,468.
Bitcoin Price (BTC in USD) Values in 2018
$3,469 = December 3, 2018: Mining for Bitcoin Became Unprofitable
Through the last few years, every other week, the difficulty in mining Bitcoin has become more and more intense. However, at the start of December, the mining difficulty dropped by only the second time ever in the whole lifetime of the asset. In the process, Bitcoin dropped by 15% to accommodate the lower prices and offer mining support.
$4,275 = November 15, 2018: Bitcoin Cash’s Hard Fork Creates ABC and Satoshi’s Vision
Bitcoin Cash was filled with unruly disagreements among the developers of the blockchain, resulting in a hard fork that split Bitcoin Cash into the ABC side and the Satoshi’s Vision (SV) side. The hash war between the two tokens was brutal, though Bitcoin Cash ABC ultimately came out on top. The price of both tokens varied during this battle, and even BTC’s price suffered some, reducing in a price drop down to $4,275.
$6,415 = October 31, 2018: Bitcoin’s Whitepaper Turned Ten Years Old
Bitcoin’s community celebrated the 10 anniversary of the whitepaper’s release. In the days that led up to the anniversary, Bitcoin’s price gained about 5% in the week.
$6,497 = October 15, 2018: Fidelity Enters Crypto Trading Arena for Institutional Investors
This week for Bitcoin was preceded by a substantial amount of bad news, but Fidelity announced the launch of Fidelity Digital Assets. The new enterprise-grade custody solution created an opportunity for institutional investors that sought to get involved with the cryptocurrency industry. The newfound interest brought an increase in the price of Bitcoin with it.
$6,539 = September 18, 2018: Zaif Crypto Exchange Succumbed to Hack Worth $60 Million
Zaif, a Japan-based cryptocurrency exchange, fell victim to a hack, leading to a loss of $60 million. As this loss was publicized, Bitcoin dropped down to the lower $6,000 price level.
$6,516 = September 5, 2018: Goldman Sachs Announces No More Bitcoin Trading Desk Launch
Goldman Sachs concluded a year of exploration of a Bitcoin trading platform with the announcement that they would no longer launch their own trading desk. Some experts believe that the longtime bear market ultimately was the cause, but Bitcoin’s price dropped even more either way. (Sidenote is they are a major investor into Circle’s Poloniex crypto exchange).
$6,366 = August 7, 2018: Delay on SEC’s Decision to Rule on Bitcoin ETF Announced
The SEC unexpectedly decided to delay their decision to approve or deny several Bitcoin ETFs that had been working through regulations throughout the summer. With this news, Bitcoin price dropped, and investors started to worry that a Bitcoin ETF would never become a reality.
$6,337 = August 3, 2018: Bakkt Launch Announced by Intercontinental Exchange
The Intercontinental Exchange (ICE), which is the parent company of many major exchanges like the New York Stock Exchange, announced that they would be launching Bakkt. Bakkt, a crypto startup, was supported by Starbucks, Microsoft, and other corporate investors in the US, and set out to create an opportunity for institutional investors to be more attracted to Bitcoin.
$7,275 = July 26, 2018: Winklevoss Twins Second Gemini Bitcoin ETF Proposal Rejected by SEC
The Winklevoss brothers (Cameron and Tyler) attempted to get their Bitcoin ETF proposal approved by the Securities and Exchange (SEC) commission again, but the market lacked the maturity to gain it. The SEC expressed, at the time, that they were concerned about price manipulation, and Bitcoin’s price fell again after a week of positive movement.
$8,227 = July 16, 2018: Blackrock and Bitcoiners Hopes of Exploring Cryptocurrency Fund
Blackrock, the largest investment fund manager in the world, started quietly working on an exploration into a crypto fund, only for news to break online of their apparent intentions. Blackrock’s CEO confirmed the reports in a Reuters article, and the price of Bitcoin rose without any crypto fund being launched by Blackrock at all.
$6,656 = June 26, 2018: Facebook’s Ban on Cryptocurrency-Related Advertisements Lifted
Facebook had previously held a ban on any cryptocurrency-based advertisements but decided on June 26 to reverse it. As cryptocurrency advertisements were newly allowed on the social media platform, Bitcoin’s price rose, and many experts believed that this was the end of the bear market.
$5,928 = June 20, 2018: Bithumb Cryptocurrency Exchange Was Hacked
Bithumb, an exchange based in South Korea, became the subject of a hack, resulting in a theft of $31 million in cryptocurrency by hackers. Bitcoin’s price dropped substantially, making Q2 of the year a difficult one for investors.
$6,709 = June 11, 2018: Subpoenas Were Filed Against Four Crypto Exchanges by US CFTC
Bitstamp, Kraken, ItBit, and Coinbase all received subpoenas from the U.S. Commodities and Futures Trading Commission to learn about manipulation in the crypto market. Over time, the majority of exchanges were exposed for their wash trading and other forms of manipulation.
$7.609 = May 24, 2018: Criminal Probe by US DOJ Over Bitcoin Price Manipulation Allegations
Leading up to the subpoenas, the U.S. Justice Department opened a criminal probe to examine if the exchanges were involved in the manipulation of cryptocurrency prices. Some proposed tactics involved included spoofing, wash orders, and pump and dump schemes.
$8,372 = May 11, 2018: UpBit Raided by Prosecutors in South Korea
South Korea’s largest crypto exchange, UpBit, was subjected to a raid by prosecutors after suspicions of engaging in fraud arose. Though Bitcoin initially took a hit that brought down the price to $8,511, the rest of the week led to a further fall to $8,372.
Goldman Sachs was featured in the New York Times over reports that the financial giant aimed to launch a Bitcoin trading platform of their own. This platform would have allowed bitcoin trading by Goldman Sachs clients from their current investment accounts.
$7,127 = March 26, 2018: Ban on Cryptocurrency Advertisements Issued by Twitter
Twitter followed the lead of Facebook and Google by imposing their own ban on advertising for cryptocurrency and initial coin offerings. The ban was imposed until policies could be clarified for the social media website.
$8,570 = March 14, 2018: Ban on Cryptocurrency Advertisements Issued by Google
Google followed the path of Facebook, establishing a ban against both initial coin offerings and cryptocurrency advertisements. The “bad advertisements” policy was updated for Google to include language for cryptocurrency specifically.
$8,344 = March 7, 2018: New and Existing Cryptocurrency Exchanges Required By SEC
The U.S. Securities and Exchange Commission reminded the public that every cryptocurrency-related exchange must register with their agency before operating in the United States. Bitcoin’s price remained fairly steady through these reminders.
$8,211 = January 31, 2018: Modified Ban on Cryptocurrency Ads Issued by Facebook
Facebook started a trend that prevented users from using the social media platform as a way to advertise cryptocurrency companies and their initial coin offerings. The advertisement ban by Facebook followed multiple complaints of malicious activities in the industry, including scams and ICO fraud.
$8,775 = January 26, 2018: Coincheck Freezes Withdrawals After Largest Recorded Bitcoin Hack
Coincheck established itself already as one of the largest exchanges to be based in Japan, but the largest hack of any platform in the history of the industry forced them to halt withdrawals. The hackers managed to run off with 500 million NEM and $123 million in XRP, though the total amount lost by the exchange was well over $600 million, and no hack has ever been greater in the cryptocurrency industry.
$8,776 = January 13, 2018: 80% of All Bitcoin Has Been Mined
Though it had been less than ten years since the mining of the Genesis Block of Bitcoin, reports indicate that 80% of the total Bitcoin supply has already been mined, leaving only 20% left.
$10,685 = January 8, 2018: Korea Regulatory Proceedings Cause Drastic Fall in Bitcoin
South Korean cryptocurrency exchanges were no longer listed on CoinMarketCap in a process that happened overnight. Soon, prices of cryptocurrency assets dropped all over the world as investors became worried as the trading volumes and activity got ‘adjusted’.
$13,870 = January 2nd, 2018: Peter Thiel Reportedly Purchased Large Numbers of Bitcoin
Peter Thiel, a venture capital investor of Silicon Valley, made history as he purchased millions of dollars in Bitcoin in January 2018, according to reports from the Wall Street Journal. At the time of Bitcoin’s $13,870 value, Thiel’s Founder Fund allegedly was worth millions of dollars in Bitcoin.
$17,163.38 = December 28, 2017: South Korea’s Authorities Close Exchanges to Stifle Crypto
New financial regulations for cryptocurrency exchanges in South Korea were proposed, bringing down the formerly positive momentum that had ruled Bitcoin for so long. Regulators reportedly imposed stricter rules as a result of the worry that “cryptocurrency speculation has been irrationally overheated in Korea.”
Bitcoin Price (BTC in USD) Values in 2017
$19,783 = December 18, 2017: Bitcoin Reached All-Time High Value
Bitcoin’s price has never been higher as the digital asset reached $19.783. To this day, Bitcoin has never had just a high price, and many experts hope that the price soon returns.
$17,010.53 = December 11, 2017: Bitcoin Futures Contracts Were Introduced by CBOE
As Bitcoin futures contracts launched, the price of Bitcoin started surging, eventually reaching its highest price ever a week later. This price boosted so quickly that two temporary trading halts were imposed in an effort to calm down the futures markets. CME Group actually beat CBOE to the launch of Bitcoin futures products, but CBOE was the first to launch trading too.
The SegWit2x upgrade was originally scheduled on November 16. However, developers dropped their support, and the upgrade was cancelled.
$7,255 = October 31, 2017: Bitcoin Futures Contract Launched by CME Group
The Chicago Mercantile Exchange, also known as CME, announced their plan to launch Bitcoin futures with a deadline for the end of 2017. This became one of the first times that mainstream financial institutions started to be interested in Bitcoin to be used as a true investment tool, which was a big step for the industry. With this news, Bitcoin’s price rose to a then-high of $6,601 with a market cap of $110 billion.
Soon after this news, the Chicago Board of Exchange (CBOE) announced that they were launching Bitcoin futures. CBOE is a direct competitor of CME.
$5,943 = October 13, 2017: Bitcoin Broke $5,000 Price Level for the First Time
Even though Bitcoin began 2017 at around $966, the cryptocurrency asset passed $5,000 for the first time, settling at $5,243 for the time being.
$3,714 = September 15, 2017: Bitcoin Crypto Exchanges in China Ordered to Shutdown
Cryptocurrency exchanges were ordered to shut down operations in China by authorities. The orders caused Bitcoin’s price to drop as panic spread across the industry.
$3,807 = September 12, 2017: CEO Jamie Dimon of JPMorgan Chase Called Bitcoin a “Fraud”
Jamie Dimon, the CEO of JP Morgan Chase & Co., publicly condemned Bitcoin as a “fraud,” commenting that the situation of anyone invested in it wouldn’t “end well.” He stated that any employee that was “stupid enough to buy bitcoin” would be fired from his company. While these statements were fairly strong from someone deeply involved in traditional finance, Bitcoin followers appeared unbothered, as the price barely moved.
$4,224 = September 3, 2017: Initial Coin Offerings Banned in China
Through the whole of 2017, initial coin offerings ruled the cryptocurrency space, but China decided to take a firm approach to the fundraising efforts by issuing a ban. The notice stated that Chinese companies were not allowed to raise money with the use of token sales, stating that there was concern of frauds and scams in the industry.
$3,384 = August 1, 2017: Bitcoin Splits Through Hard Fork into Bitcoin and Bitcoin Cash
Though Bitcoin had a solid rise for the first half of 2017, a challenge involving the scaling debate of Bitcoin’s network arose. This challenge resulted in Bitcoin splitting into Bitcoin and Bitcoin Cash deciding to split into two cryptocurrency assets, and each one moved forward with different proposals on dealing with their scaling proposals.
$1,215.69 = April 1, 2017: Bitcoin Recognized in Japan As A Legal Currency
Though months of debate preceded the decision, Japan’s government chose to recognize Bitcoin as a legal method of payment in the country. With the new regulations in the country, exchanges would have to follow similar protocols to banks, requiring rules for know your customer (KYC) and anti-money laundering (AML) protocols.
$1,038 = March 10, 2017: SEC Denies Bitcoin Exchange Traded Fund by Winklevoss Brothers
Presented with the Bitcoin ETF by the Winklevoss twins for the first time, the Securities and Exchange Commission chose to deny the application. The SEC, at the time, stated that the price market lacked the stability and maturity to withstand and ETF.
$807 = January 3, 2017: Bitcoin Passed $1,000 Price Level for First Time in Three Years
While Bitcoin primarily rallied for the majority of 2016, resulting in the breach of $1,000 for the first time in the last three years.
Bitcoin Price (BTC in USD) Values in 2016
$749 = November 9, 2016: Donald Trump’s Presidential Victory Causes Stock Market Plummet
Surprising much of the public, Donald Trump was elected the President of the United States in the 2016 election. With this POTUS news, global markets dropped in the US, Japan, and even Hong Kong. However, Bitcoin rose by 5% against these markets, as traders and institutions started to see Bitcoin as a technique to protect themselves from the movements of the global market. Donald Trump would go on to even tweet about Bitcoin for the first time on July 11, 2019.
$591 = August 2, 2016: Cyber Attack Against Bitfinex Steals $72 Million
Bitfinex announced a tragic loss of the bitcoins belonging to 119,756 customers in a massive security breach. At the time, the combined value of this loss was $72 million, as Bitcoin’s price plunged by 20%. This hack caused a lot of turmoil in the bitcoin community, since the Bitcoin price dropped before the public announcement of the Bitfinex hack, suggesting that there were certain holders that had inside information regarding the attack.
$674 = July 9, 2016: Bitcoin Halves for the Second Time
Bitcoin’s block reward was cut in half for the second time since Bitcoin became active, dropping from 25 BTC to 12.5 BTC for each block mined.
$454 = May 2, 2016: Craig Wright Claims to Be Satoshi Nakamoto
Craig Wright published a blog that outlined his claim that he is the creator of Bitcoin, better known as Satoshi Nakamoto. Wright uploaded a private key signing, aiming to demonstrate his control over the original bitcoin mined by Satoshi in 2009 and 2010. Despite his best efforts, the Bitcoin community managed to poke many holes in his statements by the end of the day, though Wright has not stood down from his claims to this day.
$461 = April 27, 2016: Bitcoin Payments Accepted by Steam
Bitcoin started to be accepted as payment on the Steam PC gaming platform, allowing consumers to use it for the purchase of video games and other digital content available. Valve, the creator of Steam, announced that the Bitcoin payment processor for the platform would be Bitpay.
$426 = April 4, 2016: OpenBazaar Became One of First Decentralized Marketplaces
The launch of the OpenBazaar’s decentralized marketplace was an effort to create a market for P2P trading that was free of fees, trade restrictions, and middlemen. Later on, the marketplace ultimately revealed that they had received $1 million in funding, thanks to Union Square Ventures, Andreessen- Horowitz, and other major venture capital firms.
$434 = February 21, 2016: Bitcoin Developers and Miners Proposed Segregated Witness
Segregated Witness, also known as SegWit, was the product of a discussion between members in the Bitcoin community in Hong Kong. The idea was meant to solve congestion in Bitcoin transactions, and the group agreed the create the scalability for Bitcoin to become an international payment system.
Bitcoin Price (BTC in USD) Values in 2015
$461 = December 8, 2015: Reports by Wired Claim That Satoshi Nakamoto is Craig Wright
The original idea that suggested Satoshi Nakamoto’s identity was Dr. Craig S. Wright was published by Wired. The publication stated that either the Australian businessman was Satoshi himself or a “brilliant hoaxer,” based on the emails, deleted blog post, and leaked court documents that were used as resources by Wired writer and security researcher Gwen Branwen.
Privately, Wright later provided additional proof that the suggestion was true, only to be disputed victoriously by the Bitcoin community.
$334 = November 3, 2015: Unicode Accepted Bitcoin’s Symbol
The Unicode Technical Committee validated the growing influence of Bitcoin by accepting its symbol into the Unicode standard. The symbol was assigned to slot U+20BF SIGN.
$366.67 = October 31, 2015: The Economist Features Bitcoin on Front Page for the First Time
An article titled “The Trust Machine” put Bitcoin on the front page of esteemed publication The Economist. Economic liberalism, the usability of blockchain tech, and the potential for national banks to release their own digital currency were all discussed in the article.
$318.43 = October 22, 2015: EU Decides Not to Impose a VAT on Bitcoin Trades
Based on a ruling by the European Court of Justice, value-added-tax (VAT) will not be applicable to Bitcoin and virtual currencies within the European Union. This ruling means that Bitcoin would fall more under the category of currency, rather than being property or a commodity. The decision was directly contradictory to the stance of regulators in the United States.
$268 = October 5, 2015: Winklevoss Twins Launched Gemini Exchange in New York
The Gemini Exchange was officially launched in October 2015 by Cameron and Tyler Winklevoss, also known as the Winklevoss twins. The brothers are notable for their involvement in the early development of Facebook. The US-based and US-regulated Bitcoin exchange was already licensed for operation in 26 states by the launch, based on their existing partnership with a bank in New York. This relationship also ensured that deposits by customers were covered by FDIC insurance, which is a benefit presently afforded to normal bank accounts.
$238.15 = September 18, 2015: CFTC Classified Bitcoin as a Commodity
Charges were filed and settled by the U.S. Commodity Futures Trading Commission against an exchange for Bitcoin that made it possible to trade options contracts. This settlement was part of the determination that “bitcoin and other virtual currencies are properly defined as commodities.”
$232.05 = June 3, 2015: BitLicense Introduced By New York for Crypto-Trading Within the State
The launch of the BitLicense in New York makes the state one of the most progressive in cryptocurrency regulation. The requirement established a new standard for the local industry, ensuring that any cryptocurrency exchange that wanted to operate in New York would have to obtain the license from the New York Department of Financial Services.
A BitLicense requires a $5,000 application fee, a record of employee fingerprints, and written approval for every new business activity. The exchanges that were not quite as transparent with their activities in the state soon found themselves ceasing operations after the launch of BitLicense.
$222.85 = January 26, 2015: Coinbase Launched Itself as Platform for Bitcoin Trading in US
Coinbase, a Bitcoin payment processor that is backed with venture capital investments, announced their own trading platform. The launch followed months of working to secure a relationship from the state and federal regulators. When it was launched, Coinbase made it possible for customers in half of the US states to legally perform trades.
$198.59 = January 4, 2015: Bitstamp Hack Resulted in $5.2 Million Loss
Though the Bitcoin market was already dealing with a bear market, the situation became even worse after the theft of 18,866 Bitcoins from a hot wallet with Bitstamp. With social engineering tactics against the system administrator for Bitstamp, the hackers made off with $5.2 million of Bitcoin. The exchange had to be shut down for eight days, but Bitstamp’s cold storage remained secured. Furthermore, customer balances were not impacted, and the loss was only a “small fraction” of the reserves that Bitstamp held.
Bitstamp is still an active exchange, which is a much better fate than other large exchanges have managed.
Bitcoin Price (BTC in USD) Values in 2014
$324.87 = December 11, 2014: Bitcoin Accepted by Microsoft
With the acceptance of Bitcoin by Microsoft, U.S. customers became able to exchange Bitcoin for apps, games, and other digital content, using the Xbox and Windows online stores. Their Bitcoin payment provider was, and is, Bitpay.
$387.40 = October 6, 2014: BearWhale Bitcoin Transaction Filed by Bitcoin Exchange
October 6 was marked as one of the biggest “sell” orders to ever reach the Bitcoin blockchain, as an unknown trader put up 30,000 BTC for sale on Bitstamp. The limit price of the BTC was $300, and the order was deemed “BearWhale” by the Bitcoin community. While the order was filled, Bitcoin’s price suffered in the process.
$528.88 = July 18, 2014: Bitcoin Accepted by Dell
Dell, the computer giant, announced that U.S. customers were able to use Bitcoin, making them to biggest company to accept the crypto asset. Bitcoin payments were launched by many other computer hardware companies in 2014, including Overstock, TigerDirect, and Newegg, which influenced Dell’s decision.
$628.50 = June 27, 2014: US Government Auction Sold Off 30,000 Bitcoin
30,000 Bitcoins, seized in an October 2013 raid, were sold by the U.S. Marshals Service. The raid of the Silk Road darknet marketplace allowed the government to auction off the Bitcoins to the highest bidder, as the majority of the Bitcoins were purchased by billionaire venture capitalist Tim Draper.
To date, Draper is still one of the biggest bitcoins hodlers.
$592.28 = June 13, 2014: 51% Bitcoin Network Control Temporarily Secured by GHash.io
GHash.io, a mining pool, gained majority control over the hashing power of the Bitcoin network, which gave them the option of launching a 51% attack on the network. This type of attack would create a temporary reversal of the Bitcoin transactions, though the pool issued a statement to clarify that it would never perform such an attack. The statement added that the pool would not exceed 39.99% in hash power from now on.
$501.70 = April 10, 2014: Exchange-Related Bank Accounts Shutdown by People’s Bank of China
Chinese financial institutions had a deadline of April 15 for stopping all interactions with both Bitcoin itself and related exchanges. Exchanges lost access to their bank accounts in the country, as they switched to offshore banking solutions.
$453.05 = March 26, 2014: Bitcoin Will Be Taxes, According to IRS
The U.S. Internal Revenue Service issued a declaration that Bitcoin could be taxes as property, but not like currency. With this classification, Bitcoin and other cryptocurrency assets would be subjected to certain restrictions, including capital gains tax.
$631.25 = March 6, 2014: Dorian Nakamoto Identified as Satoshi Nakamoto by Newsweek
Newsweek, the news media outlet, published an article about a man named Dorian Nakamoto, as journalist Leah McGrath Goodman stated that the retired computer engineer was the true creator of Bitcoin. Dorian, however, denied any involvement, and additional investigation confirmed his lack of connection with Bitcoin. However, the cryptocurrency community ended up raising $23,000 for him.
$662 = February 24, 2014: Mt. Gox Suddenly Shut Down
In the wake of DDoS attacks on February 7, Mt. Gox stopped all withdrawals. Within a few weeks, the once-successful platform shut down, following the discovery that 744,000 bitcoins were missing from cold storage. The exchange was bankrupt, and Bitcoin’s price took a massive tumble.
$626 = February 7, 2014: Mt. Gox and Other Exchanges Endured Major DDoS Attack
Multiple exchanges were simultaneously his with DDoS attacks, shutting them down for several days. The exchanges impacted were Mt. Gox, Bitstamp, and BTC-E, among others.
Bitcoin Price (BTC in USD) Values in 2013
$839 = December 5, 2013: Financial Institutions in China Banned from Bitcoin Use
The People’s Bank of China took note of the rising popularity of Bitcoin in their country, opting to ban its use as a form of currency to preserve their own financial system. Financial institutions were quickly banned from using Bitcoin.
$921 = November 29, 2013: Mt. Gox Recorded $1,242 Bitcoin Value
Prices reached an all-time high on November 29 as more investments in China pushed them up. Citizens in the country gravitated towards the currency as a way to protect themselves from the Chinese Yuan, which was quickly inflating.
$1,075 = November 20, 2013: Chinese Citizens Allowed to Trade Bitcoin/Own Cryptoassets
Chinese citizens were given freedom to engage with Bitcoin’s market by the People’s Bank of China, according to a statement from the bank. This ability makes it possible for Chinese citizens to purchase and sell Bitcoin en masse. With this news, Bitcoin’s price spiked, and the trading volume of Bitcoin reached new heights.
$1,072 = November 18, 2013: Bitcoin Hearing in US Senate Delayed
Ross Ulbricht’s arrest led the U.S. Senate to hold a discussion called “Beyond Silk Road,” which discussed the “potential risks, threats, and promises” of virtual currencies. Some panelists and senators believed that Bitcoin was a risk that wasn’t worth taking, while others believed in its potential.
$135.12 = October 1, 2013: Dread Pirate Roberts aka Ross Ulbricht Arrested
Following the clues, the Federal Bureau of Investigation managed to arrest Silk Road owner Ross Ulbricht. The dark web marketplace had established itself as the underground place for the sale and purchase of drugs, guns, and other illegal goods for Bitcoin. Ulbricht was charged with multiple crimes, including computer hacking and money laundering, and lost 170,000 BTC in the process.
Ulbricht was sentenced to lift in prison, without the possibility of parole, later on.
$126.94 = August 30, 2013: Tradehill Ceased Operations
Tradehill, a business-to-business exchange platform, shut down their operations and gave funds back to their clients after a falling out with Archive Federal Credit Union. The company’s financial partner decided against dealing with the regulatory concerns of Bitcoin.
$126.94 = May 14, 2013: Mt. Gox Received Warrant from Department of Homeland Security
After an investigation by the U.S. Department of Homeland Security, Mt. Gox CEO Mark Karpeles lost $3 million from a bank account with Wells Fargo in a seizure from the authorities. The investigation revealed that Karpeles was sending money illegally, against the terms associated with the account. Users started doubting Bitcoin’s ability to achieve future legal status.
$122.90 = April 10, 2013: Mt. Gox Shut Down Due to High Trading Volume
Mt. Gox’s trading volume surged as a result of user activity on the exchange, though it was first mistaken as a DDoS attack. The exchange was forced to shut down as a result of the demand, which caused worry by the Bitcoin community.
$131.07 = March 25, 2013: Cyprus Government’s Bailout Correlates with BTC Price Surge
Cyprus was the recipient of a €10 billion bailout, aiming to fix the failure of the economy, though it came with a certain caveat: account that exceeded €100,000 would be subjected to fees and restrictions. These restrictions were responsible for boosting Bitcoin from $80 to $260 within a few weeks, as users gravitated toward the “safe haven” offered by Bitcoin.
$68.89 = March 11, 2013: Bitcoin 0.8.2 Update Released
Transaction problems caused Bitcoin to temporarily come to a hard fork, marking a hard week for the asset. Mt. Gox chose to suspend operations as the developers followed through with a resolution within a few hours. To prevent this problem from happening again, version 0.8.1 was released.
Bitcoin Price (BTC in USD) Values in 2012
$13.43 = November 28, 2012: Bitcoin Halves for the First Time
With the writing of the original code of Bitcoin, Satoshi Nakamoto had designed a halving plan, automatically cutting the number of BTC awarded to miners by half every four years. The first application of this halving took place on November 28, bringing the reward down from 50 BTC to 25 BTC with every block mined.
$12.46 = November 15, 2012: Bitcoin Accepted by WordPress
WordPress released a statement that announced their acceptance of Bitcoin as a payment option, due to the restrictions they were facing from companies like PayPal and Visa. WordPress stated that these companies and others were blocking 60 countries around the world from performing transactions, including Haiti and Ethiopia.
The statement noted, “Our goal is to enable people, not block them.”
$11.18 = August 17, 2012: Bitcoin Payments Halted for Bitcoin Savings and Trust by SEC
Trendon T. Shavers was charged for defrauding investors as the result of his Bitcoin investment scheme by the US Securities and Exchange Commission. After accepting 50 BTC deposits from users in the BitcoinTalk forum, he paid out interest on a weekly basis. The operation was halted on August 17, and Shavers attempted to disappear with 86,000 and 500,000 bitcoins from investors.
$4.89 = March 1, 2012: 46,000 Bitcoin Lost in Linode Hack
Web host Linode was subjected to a hack by an anonymous attacker on their servers, which enabled the attacker to access wallets holding massive numbers of Bitcoin. Stealing over $228,000 worth of Bitcoin, the most notable victims in the hack included bitcoin’s lead developer, Gavin Andresen, bitcoin exchange Bitcoinica, and mining pool operator Marek ‘Slush’ Palatinus.
$4.31 = February 11, 2012: Paxum and Bitcoin Closed Crypto Operations, Sold Off Bitcoin
The week of February 11 wasn’t a great week for Bitcoin. Paxum, an online payment processor, decided to stop all transactions involving cryptocurrency on February 11, citing legal concerns as the reason. Within two days, TradeHill followed along by selling off Bitcoin to issue refunds to customers and creditors. The next date, a security bug on BTC-E Bitcoin Exchange was announced by BitcoinTalk forum user Patrick ‘phantomcircuit’ Strateman.
Bitcoin Price (BTC in USD) Values in 2009-2011
$4.22 = December 19, 2011: “The Good Wife” Features “Bitcoin for Dummies” Episode
When Bitcoin was still in the first few years of its life, an episode of “The Good Wife” decided to capitalize on the new technology. The exposure to 9.45 million viewers was expected to push the assert to new heights, but few viewers appeared to be interested as the price remained in place.
$17.77 = June 19, 2011: Mt. Gox Hacked – Bitcoin’s First Big Black Hole
Mt. Gox was hacked by an auditor working for the exchange, who downloaded a copy of the user database for access to passwords. With the ability to access admin-level privileges, the auditor caused the price to drop to $0.01 per Bitcoin with the many sell orders posted to the system.
Mt. Gox was able to stop trading for a week when they discovered the issue, reversing the trades and improving security on their systems. Of the 600 compromised wallets, over 4,019 Bitcoins were stolen.
$16.88 = June 1, 2011: Gawker News Publishes Expose Article on Dark Web Website Silk Road
Adrien Chen, a writer for Gawker, published an article titled “The Underground Website Where You Can Buy Any Drug Imaginable.” This article came with a lot of controversy, describing how consumers could use the would-be criminal-enterprise platform Silk Road for the purchase of nearly anything with Bitcoin. The article gained a lot of traffic, bringing Bitcoin up from $9.21 to $17.61.
Bitcoin peaked at $31 within a week of the Gawker article being published.
$0.072 = March 27, 2011: Three Bitcoin Exchanges Officially Launched
Britcoin, a new crypto exchange, was launched in March, making it possible for users to trade with the use of the British Pound for the first time ever. Soon after, an exchange in Brazil followed this lead by launching a service for the Brazilian Real to trade with Bitcoin as well.
Bitmarket.eu launched on April 5, which allowed users to use the Euro to trade Bitcoin, which had never been done before. The three exchanges made it possible for millions of new users to enter the Bitcoin market.
$1.00 = February 9, 2011: Bitcoin Matched Value of US Dollar
Bitcoin reached the same value as the US dollar by the time it was about two years old, which was the first time in history that it reached parity with the largest fiat currency in the world. Price quickly rose with this news.
$0.07 = August 15, 2010: Fraudulent Bitcoin Transaction Process Results in Hard Fork
A computer number processing error allowed a fraudulent Bitcoin transaction to be created by an anonymous user, generating almost 99,000 more Bitcoin that can ever exist in the system. Bitcoin developers spotted and corrected the issue in a matter of hours.
$0.06 = July 18, 2010: Mt. Gox Exchange Launched
Jed McCaleb launched Mt. Gox on July 18, which was based on the previous (but failed) Magic: The Gathering Online card exchange platform (MTGOX). Mt. Gox grew through the next three years to become the largest exchange for Bitcoin online, and McCaleb sold the exchange to Mark Karpeles by March 7, 2011, long before this massive success and eventual failure.
$0.08 = July 11, 2010: Slashdot Article Featured Bitcoin
Slackdog.org, a popular website for news and technological developments, featured the release of Bitcoin’s 0.3 version. Interest in Bitcoin rose, bringing the price up from $0.008 to $0.08 in five days.
$0.0025 = May 22, 2010: Two Pizzas Became First Items Purchased with Bitcoin
Laszlo, a user on the Bitcointalk forum, paid for two pizzas with 10,000 BTC, valued at $25. Jercos, another user on the platform, ordered and paid for the pizzas, marking the first time that Bitcoin had been used for a real, tangible item.
$0.001 = October 12, 2009: First Bitcoin-to-Fiat Transaction Took Place
New Liberty Standard made a purchase of 5,050 BTC with the use of PayPal for $5.02. This is the first known trade with Bitcoin and any fiat currency.
$0.0008 = October 5, 2009: New Liberty Standard Launched Bitcoin Exchange Rate Service
New Liberty standard launched as a service for exchanging fiat for Bitcoin, using a rate of 1,309.03 BTC to 1 USD, or about $0.0008 per 1 BTC. The rate was calculated by considering the cost of electricity used for the mining of a single Bitcoin on the computer at the time.
$0.00 = January 12, 2009: First Bitcoin Transaction Took Place
On January 12, Bitcoin creator Satoshi Nakamoto transferred 10 bitcoins to developer and cryptography activist Hal Finney as the first-ever Bitcoin transaction. The transaction was tweeted about by Finney, who later joked that he’s never paid it back to Satoshi.
$0.00 = January 3, 2009: Genesis Block for Bitcoin Established
Bitcoin creator Satoshi Nakamoto mined the first Bitcoin block, setting the Bitcoin blockchain into motion.
Make sure to utilize the most detailed bitcoin price history timeline to see how far the biggest and best cryptocurrency has come in its first decade. Now, to wrap up our crypto trader and investor bitcoin price user guide, let’s close out with an FAQ on the BTC/USD calculations to review all remaining elements.
FAQ About the Price of Bitcoin and BTC Exchange Rate
We get a lot of questions about the price of bitcoin and the bitcoin exchange rate. Here are some of the most frequently asked questions we receive.
Q: Where does bitcoin’s exchange rate come from? Who measures the exchange rate?
A: Different websites measure bitcoin’s exchange rate using different sources. The best websites use multiple major exchanges and up-to-the-second trading data to get bitcoin’s exchange rate. How much did someone just pay for bitcoin? For how much did someone just sell bitcoin? What was the last price someone paid for bitcoin? By aggregating data from multiple sources, exchange rate reporters can get the most accurate data possible for current market conditions.
Q: Who controls the price of bitcoin?
A: Buyers and sellers in open markets control the price of bitcoin. There’s no central entity that can dictate the price of bitcoin.
Q: Can any single person influence the price of bitcoin?
A: It’s certainly possible that a single institution or individual can control the price of bitcoin, although it’s less likely as the market becomes more liquid. If Satoshi suddenly dropped his rumored 1 million BTC stash on the market, however, then it would cause a price drop unlike anything we’ve seen before. Few other people – even whales with millions of dollars’ worth of bitcoin – can singlehandedly affect markets like this.
Q: Who controls the emission rate or inflation rate of bitcoin?
A: Bitcoin’s block reward is its de-facto emission rate or inflation rate. Every 10 minutes, 6.25 BTC is added to bitcoin’s available supply through this block reward system. This block reward is hardcoded into bitcoin just like its total supply. It’s designed to be cut in half roughly every four years, all the way up to the year 2140 when the last bitcoin is scheduled to be mined.
Q: Why is bitcoin’s price so volatile? Why does bitcoin’s exchange rate fluctuate so much?
A: Bitcoin is well-known for its volatility. Ten years ago, bitcoin was worth less than a penny. Over the last two years, bitcoin has been worth anywhere from $3,000 to $20,000, depending on when you checked the price. Bitcoin’s volatility may seem extreme, but it’s what we expect from a new asset and a new marketplace. The market is trying to find the price of bitcoin, so prices will naturally rise and fall. See above for the main reasons why bitcoin’s price rises and falls.
Q: How can bitcoin be a store of value if its price is constantly changing?
A: Bitcoin’s price has fluctuated wildly over the years, leading many people to claim that bitcoin is a poor store of value. It’s certainly possible that bitcoin will be a poor store of value long-term, although it’s tough to say one way or another at this point. Gold’s value has also fluctuated over time, yet it remains one of the best stores of value in history.
Q: Is bitcoin a bubble?
A: It’s certainly possible that we’ll look back on bitcoin 15 years from now and laugh at the biggest, silliest bubble in history. It’s also possible our grandkids will ask us 50 years from now if bitcoin was really worth only $10,000 when we were little. Put simply, nobody knows where bitcoin is going to go, what will happen to bitcoin’s price next, and whether or not bitcoin is really in a bubble.
Q: Why is bitcoin’s total supply fixed? How do we know there are only 21 million bitcoins?
A: Bitcoin’s total supply is fixed. It’s hardcoded into bitcoin’s core rules. There can only ever be 21 million bitcoins in existence.
Q: Can bitcoin’s total supply be changed?
A: It’s technically feasible to change bitcoin’s overall supply. Just like most bitcoin rules, these changes require the support of the majority. If enough people want to change bitcoin’s supply cap, then that supply cap will change.
Q: How many bitcoins are on the market today?
A: 18 million bitcoins have been mined from January 2009 to November 2019. The remaining 3 million bitcoins are scheduled to be mined between 2019 and 2140, with the block reward being cut in half every four years. In reality, the number of bitcoins in circulation is much lower. Certain people are never going to sell their bitcoins for less than a certain price, for example. Millions of bitcoins have also been destroyed or lost.
Q: Why is May 2020 an important time for bitcoin?
A: May 2020 is one of the most important upcoming dates in bitcoin’s future. On May 14, 2020, bitcoin’s block reward will be cut in half from 12.5 BTC to 6.25 BTC. Overnight, the emission rate – or inflation rate – of bitcoin will be cut in half. Both of the two previous halvings (50 BTC to 25 BTC and 25 BTC to 12.5 BTC) have led to a sudden spike in bitcoin prices.
Q: Isn’t bitcoin intrinsically worthless? How will it have long-term value?
A: It’s true that the price of bitcoin isn’t fixed to any specific asset. However, bitcoin still has intrinsic value. The bitcoin blockchain gives bitcoin value, for example. Bitcoin lets you securely transfer money from one person to another without the need for a centralized intermediary. That’s where the value of bitcoin comes from.
Q: What happens when all the bitcoins are mined? Won’t bitcoin’s price drop?
A: The last bitcoin is scheduled to be mined in 2140. To date, only about 15% of bitcoin’s are still unmined. Once the last bitcoin has been mined, miners will earn money through transaction fees. Miners already collect transaction fees and block rewards when they successfully mine a block. After 2140, they will only collect transaction fees. Nobody really knows where bitcoin’s price will be in 2140, and it’s tough to predict what will happen. However, bitcoin is designed to continue running smoothly even after the last bitcoin is mined.
Q: What is bitcoin’s smallest unit of account, the satoshi, have to do with the price of BTC?
A: There are 100 million satoshis per 1 bitcoin, or 1 satoshi is 0.00000001 BTC. Due to bitcoin’s infinite divisibility, the satoshi is the basic building block of bitcoin’s measurable value, in which there will only be 2 Quadrillion, 100 Trillion Satoshis (or 21 quantrillions Satoshis) ever created. This digital scarcity starts to matter when Bitcoin could no longer be measured in US dollar amounts like it is today.
Final Word: How Is Bitcoin’s Price Determined?
Bitcoin’s price is determined by two simple economic factors: supply and demand. The supply of bitcoin is fixed, although the demand for bitcoin keeps rising. Demand rises as more people hear about bitcoin, as bitcoin’s technology grows and improves, and as bitcoin becomes more useful. And who knows, while this user guide on how bitcoin’s price works surely has helped, if you ‘hodl’ long enough you may not have to worry about the price of BTC measured in USD and start with the smallest unit of account in bitcoin, the satoshi.
There is no such thing as a bitcoin millionaire, as a million is calculated based in US dollars and one day the BTC to USD exchange rate will simply be BTC to BTC (at least how the matrix meme maps out the possible future).
For more bitcoin price resourcues, check out chart analysis, prediction forecasts and 2020 halving updates.
In closing, when demand rises and supply stays fixed, prices will inevitably rise. That’s the simplest way to understand bitcoin’s price and exchange rate.
Aziz, Master the Crypto Founder
I’m Aziz, a seasoned cryptocurrency trader who’s really passionate about 2 things; #1) the awesome-revolutionary blockchain technology underlying crypto and #2) helping make bitcoin great ‘again’!
The post Bitcoin Price Today: BTC/USD Exchange Rate Value Guide appeared first on Master The Crypto.
Bitcoin Trading Guide for Intermediate Crypto Traders
This bitcoin chart analysis guide is built to be your one-stop-shop tutorial for intermediate crypto trading.
Crypto trading seems complicated at first glance. Fortunately, it’s not nearly as perplexing as you think. Once you learn how to read charts and perform basic technical analysis, it all starts to come together.
While this bitcoin trading analysis review is not catered to newbie’s and more geared towards intermediates. And yes, there are differences between crypto investing vs crypto trading or using a automated bitcoin trading bot if you want to start analyzing BTC price charts and understanding crypto market graphs. For this bitcoin chart analysis guide, we assume you have some basic knowledge of how crypto works, what bitcoin is, how cryptocurrency exchanges work, the types of crypto categories, and how blockchain functions.
All successful bitcoin traders come to realize understanding these common chart patterns can translate into learning timeless skills that will accelerate results and produce profitable entries and exits no matter what the price of bitcoin is in BTC/USD. For reference, the live real-time bitcoin price exchange rate value is:
$9,522.08
Bitcoin (BTC)
1h0.00%
24h1.69%
USD
EUR
GBP
The Basics: How Does Bitcoin Trading Work?
In the early days of Bitcoin (2009 to 2014), there essentially was only one coin (BTC) and trading cryptocurrencies was overly complicated. Today, in 2019, crypto trading is still inherently risky, speculative and highly volatile – but it’s easier than ever before with even more market data to cross check and measure. Here is a look at the long laundry list of bitcoin chart analysis trading patterns and graphs covered below:
You can find plenty of great crypto exchanges, including exchanges that accept your local currency and bank transfers. You can also find plenty of amazing wallet apps, portfolio manager apps, and other tools to maximize your crypto trading experience.
Here’s the basic process behind crypto trading (although plenty of common pitfalls):
Step 1) Sign up for a cryptocurrency exchange
Step 2) Deposit funds into the platform
Step 3) Buy cryptocurrency
That’s it! It’s not that complicated. If you want to use a unique fiat currency (like CAD, AUD, or RUB), then you might need to use a local exchange. If you already have a major fiat currency (like USD or EUR), then you have a wider range of options available.
Once you have bought your first cryptocurrency, you can keep it in your exchange wallet, leaving it on the exchange for future trading or investment. Or, you can withdraw funds to your own wallet – like a mobile app on your phone.
Cryptocurrency Trading Glossary: Most Popular Terms
The crypto trading industry is filled with its own jargon. Here is a list of the 26 most popular terms with definitions you should know before getting into bitcoin chart analysis:
Fiat Currency: Fiat currencies are government-issued currencies like the US Dollar or Euro. These currencies exist in contrast to cryptocurrencies (although some countries are debating launching their own cryptocurrencies, which would blur the line between fiat and crypto). ‘Fiat’ is Latin for ‘by decree’. These currencies have the value ‘by decree’ or ‘by the statement’ of the government.
Crypto asset: A crypto asset is any token, coin, or digital currency with value. Sometimes, people will link a crypto asset to a specific technology. They might describe Ether (ETH) as the crypto asset for the Ethereum blockchain, for example.
Altcoin: Altcoins are ‘alternative coins’. Generally, this term is used to refer to any coins that aren’t bitcoin. It’s a popular term among bitcoin maximalists who believe bitcoin is superior to all other coins.
Stablecoin: A stablecoin is a digital token deliberately designed to hold a steady price. Typically, stablecoins track a specific fiat currency, and most track the US Dollar. Stablecoins work in different ways, although most stablecoins are simply backed 1:1 with US Dollar reserves, and users are allowed to swap their 1 USD stablecoin for 1 USD cash at any time, giving the token stable value.
Crypto Exchange: An exchange is a website or platform where you can buy and sell cryptocurrencies. Some exchanges only list cryptocurrencies, while others list fiat currencies and cryptocurrencies. Major exchanges today include Kraken, Gemini, and Binance, among others.
Bid Price: The bid price for a given asset is the maximum price someone is willing to pay for that asset. It’s the ‘demand’ side of the supply and demand that governs crypto markets.
Ask Price: The ask price for a given asset is the minimum price at which someone is willing to sell an asset. This is the ‘supply’ side of supply and demand.
Bid-Ask Spread: The bid-ask spread is the difference between the bid price and the ask price for a specific asset. In highly-liquid, high-volume markets, the bid-ask spread will be quite small. In smaller, lower liquidity markets, the bid-ask spread will be much larger.
Volatility: Volatility is used the same way in crypto markets as it’s used in traditional financial markets. It’s a measure of how unpredictable the markets are, or how wildly prices are currently fluctuating.
FOMO: Fear of Missing Out. If LTC suddenly jumps 10% in a 2-hour period, then it might rise a further 15% because investors have a ‘fear of missing out’ when a coin jumps in value.
FUD: Fear, Uncertainty, and Doubt. Bitcoin has been bombarded with FUD since the day it launched. Some cryptocurrency communities spread FUD about other coins. It’s the irrational worry that a specific coin will collapse or lose its value.
Buying the Dip: When a specific crypto asset drops significantly, but you see it as a buying opportunity. Let’s say bitcoin drops 5% today. You ‘buy the dip’ by buying bitcoin in the hopes that it will increase.
Bull and Bear Markets: The terms bull and bear have the same meaning in crypto as they do in traditional markets. A bull trend is a long-term, upward trend in overall cryptocurrency markets, while a bear trend is a long-term decline in the overall cryptocurrency market. If someone is ‘bullish’, they expect prices to increase. If someone is ‘bearish’, they expect prices to decrease.
Market Makers and Takers: A market maker is someone who ‘makes’ or posts a trade to the exchange. A market taker is someone who ‘takes’ or accepts that trade.
Liquidity: Liquidity, in the crypto world, refers to the volume of a specific exchange, or how easy it is to make a trade on a particular exchange. A good, high-volume exchange is said to be more liquid and have higher liquidity.
Whale: Whales are individuals or organizations that hold an enormous amount of crypto. Some are institutional hedge funds dipping their toes into crypto. Others are people who accumulated bitcoin early and never sold.
Return on Investment (ROI): How much money are you earning from a vested amount? If you bought $100 of bitcoin, then bitcoin’s price rose 50%, then you made $150 and your ROI is 50%.
Wallets: Wallets let you manage your crypto holdings. It’s the place where you store your cryptoassets – just like an ordinary wallet is a place where you store your cash and credit cards.
Hot Wallets: Hot wallets are online wallets connected to the internet. They’re typically seen as less safe than cold storage wallets, although they’re safer than exchange wallets.
Cold Wallets: Cold wallets, or cold storage wallets, are wallets that are not connected to the internet. They’re the most secure form of storage because your private keys are kept away from places where hackers can access them.
Exchange Wallets: Most exchanges have customer wallets where users can store their funds. These exchange wallets are seen as the least safe option because the exchange is in complete control of your funds.
2-Factor Authentication (2FA): 2-factor authentication refers to the use of multiple verification methods to sign in to your crypto account. Most exchanges let you set up 2FA. Some exchanges will send you a text message or email to confirm a login. Other exchanges let you set up 2FA for every time you make a trade.
Hodl: Hodl or hodling refers to the crypto investment strategy of holding crypto assets through all market conditions. Bitcoin has risen and fallen numerous times, but hodlers have been able to survive the FUD and continue holding bitcoin to this day.
Diversification: Diversification refers to the idea of owning multiple cryptoassets. Instead of having 100% of your portfolio in bitcoin, for example, you might invest 50% of it in altcoins.
Arbitrage: Arbitrage is the strategy of buying coins at one price, then selling them for a higher price in a different place. You might buy bitcoin from Binance, for example, then sell it through LocalBitcoins at a higher price in your own local fiat currency.
Pump and Dump: Pump and dump is a trading scheme that involves artificially inflating the price of a targeted asset (‘pumping’), then selling that asset after prices have increased (‘dumping’).
Now that you know these basic crypto trading terms, it’s time to look at specific aspects of crypto trading.
Types of Bitcoin Trades in the Crypto Market
For the most part, beginners will only want to make market orders. With a market order, you buy or sell cryptocurrency at the best available price. More advanced traders, however, can take advantage of limit orders, stop-loss orders, leveraged trading, and more. Types of crypto trades include:
Market Order: With a market order, you’re buying or selling crypto at the best available price. The exchange will look at the last price someone paid for bitcoin (if you’re selling) or the last price someone sold for bitcoin (if you’re buying).
Limit Order: With a limit order, you’re buying or selling crypto at a specific price. You might put a buy order to buy bitcoin if it drops below $5,000, for example. If the price point never ends up being reached, then your order may never be executed. Some exchanges let you put a time limit on limit orders.
Stop-Loss Order: Stop-loss orders let you set up a specific price at which an exchange will execute a trade to limit your losses. If the price of bitcoin drops 10%, for example, or hits a price of $7,500, then you can issue a stop-loss order to limit your losses.
Take-Profit Order: Take-profit orders let you set up a specific price at which an exchange will execute a trade to maximize your profits. If bitcoin rises 10%, for example, then your take-profit order will automatically execute, giving you guaranteed gains of 10%.
There are plenty of more advanced order types, including over the counter (OTC) trades, gorilla trades, polar bear trades, immediate-or-cancel (IOC) trades, fill-or-kill (FOK) trades, and all-or-non (AON) orders. Most beginner and intermediate traders, however, will be fine with the four trade types above.
How Much Does Crypto Trading Cost? Average Pricing
Trading cryptocurrencies isn’t free. You’ll pay exchange fees, withdrawal fees, and other charges on most exchanges. Costs of crypto trading include:
Trading Fees: Most exchanges charge maker fees and taker fees of between 0.1% and 0.5%. Typically, the taker fee is higher. You’ll pay this on every trade. If you’re trading a significant volume (say, over $500,000 per month), then the exchange might offer volume discounts, which can drop trading fees significantly.
Deposit Fees: Some exchanges charge a fee to deposit money into the platform, although this is becoming less common.
Withdrawal Fees: Withdrawal fees are far more common on most exchanges. Typically, withdrawal fees are flat fees. You might pay $5 USD to withdraw money from the platform, for example. Some exchanges also have minimum withdrawal amounts.
Fees can vary widely between exchanges. Typically, the better-regulated exchanges (like Coinbase and Kraken) charge higher fees, while the lower-regulated exchanges (like Binance and KuCoin) charge lower fees.
Intermediate to Advanced Bitcoin Analysis: How to Study Market Charts
Master The Crypto is one of the most popular cryptocurrency investment trading guide portals on the Internet and this section of our bitcoin trading chart analysis guide is geared to help everyone who is not a complete beginner get better at trading bitcoin for optimal results.
How to Analyze Crypto Markets: Fundamental and Technical Analysis
Crypto analysis falls into two major categories: fundamental analysis (FA) and technical analysis (TA).
Fundamental Analysis (FA): Fundamental analysis is a non-statistical analysis method that evaluates the value of an asset-based on economic and financial growth factors. Fundamental analysts seek to determine the profitability of an asset based on its potential. They analyze the present value of the asset, then project the future growth of that asset. You might read the project’s whitepaper and check the team, for example, to determine if the project has growth potential.
Technical Analysis (TA): Technical analysis is a purely statistical method that involves examining price charts, trading volume, and other related numbers. Technical analysts believe the price of an asset reflects market sentiment and all the necessary information at any given time, which is why they exclusively focus on statistically analyzing the price action of the asset.
These two analysis methods might seem contradictory, but they work best when used together. Smart investors take all available analysis methods into consideration.
Crypto Market Trends
Crypto markets are highly volatile and unpredictable. However, we still see plenty of crypto market trends. A market trend refers to the direction in which the price is perceived to be headed.
In a bull market, prices are trending upward (remember: bulls attack ‘up’ with their horns), while in a bear market, prices are trending downward (bears swipe ‘down’ with their paws).
Some people also use terms like a secular trend. A secular trend is a long-term market trend that lasts several decades – say, 30 years. A secular trend can be bearish or bullish, and there can be multiple mid-term primary trends within the broader secular trend.
A primary trend, meanwhile, is a smaller, short-term trend within a broader secular trend. It may run opposite of the secular trend.
There can also be secondary trends within primary trends. If a secondary trend is bullish in a bearish market, then it could be called a ‘sucker’s rally’. After months of declining prices (primary trend), the markets might seem to be suddenly going up after a week of positive movement (secondary trend), only to continue dropping for the next four weeks.
Unregulated, new markets like crypto are more prone to short-term volatility than traditional, well-established markets. With crypto investing, you can expect to see more short-term secondary trends and frequent pumps and dumps than you would see, say, on the S&P 500 index.
Support and Resistance Levels
Crypto market analysts will frequently refer to terms like support and resistance levels. These levels play a crucial role in how crypto markets function.
Picture support and resistance levels as the ‘battle lines’ between bears and bulls.
Support Level: This is the lower level of a trend at which the price is expected to bounce.
Resistance Level: This is the upper level of a trend at which the price is expected to fall.
Bitcoin might have resistance at the $10,000 mark, for example, which causes the price of bitcoin to constantly rise toward that level but never exceed it. Bitcoin might have support at the $6,000 mark, meanwhile, which causes the price of bitcoin to drop towards that level but not past it.
When the price of a cryptoasset reaches a specific support or resistance level, it’s said to be testing that level. Sometimes, the support or resistance level holds. In other cases, the support or resistance level breaks.
Looking at bitcoin’s price history, we can also see incidents where bitcoin’s price level broke a resistance level, and then that new resistance level became a support level. Let’s say bitcoin breaks the $10,000 level and surges all the way to $11,500. Suddenly, $10,000 might become the new resistance level while $12,000 becomes the new support level.
Similarly, when the price drops below a support level, the support level could become the new level of resistance. If bitcoin’s price drops below $6,000, for example, then the $6,000 limit could become the new resistance level, while a lower limit like $4,500 becomes the new support level.
In a fluctuating industry like crypto, support and resistance levels rarely stick around for long.
Buy Walls and Sell Walls
Support and resistance levels are often established because of buy walls and sell walls. You can see these walls when looking at an exchange’s order books.
A buy wall is a large number of buy orders placed at a specific price limit, while a sell wall is a large number of sell orders placed at a specific price limit.
Sometimes, these are limit orders, where traders have set a specific price at which they want to buy or sell. In other cases, they’re take-profit orders or stop-loss orders where traders are attempting to realize gains or limit losses.
In many cases, these buy walls and sell walls organize around recognizable price points. There might be a wall of sell orders at $15,000, for example, as traders seek to lock in their profits. There might be a wall of buy orders at $5,000, meanwhile, as traders seek to buy the dip. Sudden price surges or drops can easily be halted by a wall of sell or buy orders.
How to Read Bitcoin Price Charts and Crypto Market Graphs
Crypto charts might look complicated at first glance. Once you understand what everything means, however, it will seem much less complicated.
Here is what an average crypto price chart looks like:
This chart shows the BTC/USD perpetual contract on BitMEX for a two-month period from February 1 to April 1. Each candlestick (each green or red bar) represents a 6-hour interval.
You can adjust the timescale of a chart however you like. Some charts let you use intervals as small as 30 seconds, for example, while others let you use intervals of up to a year.
As with most financial charts, the Y-axis (the vertical axis) represents price, while the X-axis (the horizontal axis) represents time.
You can see the price scale on the right side of the chart. This is the interval between two price points. On this chart, the price scale is 50, which means the difference between the two price points is 50. Price scale can be linear or logarithmic:
Linear Price Scale: With a linear price scale, the distance between any two points of the same numerical difference, regardless of value, is equal. The distance between 1 and 2 is the same as the distance between 9 and 10, for example.
Logarithmic Price Scale: With a logarithmic price scale, the distance between price points is linked to the ratio of the two values. The distance between 1 and 2, for example, is equal to the distance between 4 and 8 or 12 and 24.
The difference between linear and logarithmic price scales is significant. Below, you’ll see two charts of bitcoin’s all-time price history. The first chart uses a linear price scale, while the second charts uses a logarithmic price scale:
The two charts show the exact same thing: bitcoin’s price from 2011 to the present day. However, the logarithmic chart tells a much different story than the linear chart.
With the linear chart, it looks like bitcoin’s price did absolutely nothing for the first four years of its existence. Then, there was a small price surge, a long period of limited price movement, and then bitcoin surged to a ridiculously outlying all-time high of $20,000 in December 2017 before plummeting back down.
On the logarithmic chart, bitcoin’s price movement is much less dramatic. The early days of bitcoin look especially impressive relative to the first chart. We see bitcoin’s price doubling the number of times. The difference between $2 per BTC and $200 per BTC is significant – even if it looks like a flat line on the linear chart. The jump from $5,000 to $20,000 per BTC that occurred in 2017, meanwhile, looks much less significant.
Types of Bitcoin Charts for Crypto Analysts
There are four general types of crypto charts, including line charts, bar charts, candle stick charts, and point and figure charts. We’ll talk about each chart and its unique advantages below.
Line Chart
A line chart is a simple, common chart type where the ‘line’ connects the closing prices of every time interval.
Some line charts use open, high, or low prices for each period. In most cases, however, the price reflects the closing point for each interval. If bitcoin closed at $5,000 at 3 pm and $5,100 at 4 pm, for example, then the line would be drawn between $5,000 and $5,100.
Bar Chart
A bar chart presents a more detailed representation of price action than a line chart. It shows the price at which bitcoin opened, for example, as well as the price at which it closed. Instead of just seeing one number (the closing price), you can see what bitcoin’s price did during any particular day. The high, low, and close prices are represented using a series of vertical lines with a horizontal dash on each side.
Some people also call a bar chart an ‘open high low close’ or OHLC chart. The vertical line is called the range line, and it represents the range of price for each time interval, including the high and low. The horizontal dashes, meanwhile, represent the open and close for each interval.
Here’s what a bar chart looks like when representing a period of time:
The bar chart above also uses color to indicate rising and falling intervals. A black range is used to indicate a rising interval (where the closing price was higher than the opening price), while a red range is used to indicate a falling interval (where the closing price was lower than the opening price).
Candlestick Chart
Some people call candlestick charts ‘Japanese candlestick charts’ because they were invented in the 18th century by a Japanese rice merchant, although they didn’t appear in western markets until the early 1990s.
Today, candlestick charts work in a similar way to bar charts. They allow you to see the high, low, open, and close for a particular day. However, these numbers are expressed in a slightly different way.
With candlestick charts, there is a hollow or filled body with upper and lower shadows to represent open, close, high, and low prices. The length of the body of a candlestick and its shape is also used to represent the intensity of trading activity for a specific time interval.
Here’s what each of the above candlesticks represents:
The candlestick is mostly composed of the body (the shaded area), which represents open and close prices. The upper and lower lines (the ‘wicks’ of the candle) represent high and low prices.
Essentially, you’re getting the same information as a bar chart, but this information is represented in a slightly different way.
The shaded area also plays a role. If the price closes higher than it opened, then the candlestick will be shaded green (bitcoin’s price rose during that interval). If the price closes lower than it opened, then the candlestick will be shaded red (bitcoin’s price fell during that interval). Some candlestick charts also use a fill or unfilled pattern, with the candlestick being full or shaded when prices rise and being unfilled and empty when prices fall.
Point and Figure Chart
Out of the four charts listed here, a point and figure chart are the least common. Nevertheless, a niche group of technical traders continues to use point and figure (P&F) charts to this day.
A point and figure chart shows only price movements. The X column represents rising prices and the O column represents falling prices. Time and volume are not indicated. If there is no significant price movement for a length of time, then the chart shows no new data.
With P&F charts, the value represented by each X and O is determined as a set price interval. Any price change below this value is ignored. The chart shifts to a new column (called a reversal) when the price changes in the opposite direction represented by a certain number of X’s or O’s.
In the chart above, each X or O represents a rise or fall of two dollars. A reversal occurs if there is a change in the opposite direction by a value of at least four dollars. Time can be represented in the X-axis, although it is never used as a factor in P&F charts.
What’s the point of this unique charting tool? The point is to remove the distraction or skewing effect that occurs in other chart types when accounting for time intervals with insignificant price movements. The chart only indicates significant price movements.
Nevertheless, point and figure charts are very uncommon in the crypto world today.
Also, as an additional bitcoin chart pattern resource, here is a look comparing the bullish trading charts vs the bearish trading graphs:
bitcoin trading chart analysis bull vs bear patterns from the Crypto Trading Book
Bitcoin Chart Patterns
Crypto traders will analyze charts to unveil different patterns. There are all different types of patterns. Typically, however, patterns are separated into three specific categories:
Continuation Patterns: These patterns indicate a brief consolidation period, after which the prevailing trend will continue in the same direction.
Reversal Patterns: These patterns indicate a shift in the balance of supply and demand, typically leading to a trend reversal. These patterns are sub-divided into top and bottom formations.
Bilateral Patterns: Bilateral patterns are triangle formulations that indicate a trend could sway either way.
Pattern analysis isn’t black and white. Some people might analyze a chart and see a continuation pattern, for example, while others will see a bilateral pattern. Based on the interval and previous trends, analysis can vary.
Below, we’ll talk about some of the specific types of patterns that can represent continuation, reversal, and bilateral patterns as indicated above.
Cup with Handle Pattern
A cup with handle pattern can be either a continuation or a reversal pattern depending on the previous trend. It looks like this:
A cup with handle pattern in an uptrend (as indicated above) is a bullish continuation pattern. Aside from a small blip (the cup), the upward trend will prevail. Some cups are U-shaped, while others are V-shaped. In ideal conditions, the cup has equal highs on either side before consolidating at a specific price point (the handle). The estimated price target for the next breakout after the consolidation is symmetrical to the height of the cup.
Of course, cup with handle patterns can indicate different things in a prevailing downtrend:
In this chart, the same cup with handle pattern signifies the end of a downtrend and a breakout into an uptrend. Once the cup formation transitions to a handle formation, the price must not decline beyond half the height of the cup. If the price declines more than half the cup’s height, then selling momentum is too significant and it’s no longer considered a cup with handle pattern (the ‘handle’ broke).
The longer it takes for the cup with handle pattern to form, and the deeper the cup formation, the greater the momentum behind the breakout and the higher the price target. When you add the height of the cup to the breakout point, it provides a good indication of the short-term price target.
Flags and Pennants
Flags and pennant patterns are continuation patterns. They’re formed when prices consolidated for a brief period before the market resumes moving in the same direction.
Here’s what it looks like on a traditional chart:
In this chart, we see the consolidation phase in the middle. The long-term trend takes a brief brake, creating a rectangle shape on the chart. Then, the long-term uptrend continues, the rectangle breaks, and prices continue moving upwards.
You can also have both bearish and bullish flags. With these flags, the pennant is formed by a slight sloping move in the direction opposite to the prevailing trend.
There’s also a difference between a flag and a pennant pattern. A flag is a rectangular shape, while a pennant is a triangular shape:
Flag and pennant patterns are typically preceded by a sharp rally or decline. This rally or decline forms the ‘pole’ of the flag. The distance from the support or resistance level to the ‘flag’ or ‘pennant’ is called the flag pole.
You can analyze a price target from a flag or pennant chart. Typically, you do this by adding the length of the flag pole to the top of the formation in an uptrend and by subtracting the length of the flag pole from the bottom of the formation in a downtrend.
Head and Shoulders
Head and shoulders (HS or H&S) patterns are some of the most reliable reversal patterns.
Some HS patterns are considered head and shoulders top patterns or ‘HS tops’. It’s a bearish reversal pattern that includes three parts, including two smaller peaks beside a taller peak:
By connecting the low of the left shoulder with the low of the head, we can create the ‘neckline’ of the chart. Once prices fall below the neckline, the upward trend breaks down, and markets enter a bearish trend, as seen in the chart below with the pullback and target line.
Head and shoulders bottom charts, meanwhile, are also known as HS bottoms or inverse HS charts. It’s a bullish reversal pattern (instead of a bearish reversal pattern) where the prevailing trend is downward.
Just like the HS top chart, the HS bottom chart consists of three parts, including two shallower valleys or higher lows on either side of a deeper valley or lower low.
You can calculate price targets from head and shoulders charts. For HS top charts, you can estimate the price based on the ratio of the higher high to the breakout point along the neckline. If the higher high is 40, for example, and the breakout point is 20 (a 50% decline), then the estimated target for the breakdown below the neckline would be 10, which is a further 50% from the neckline.
For HS bottom charts, meanwhile, you can calculate a price target by adding the height of the head to the breakout point using a similar method. If the lower low is 20 and the breakout occurs at 30 (a 2:3 ratio), for example, then the target price is 45.
Double Top Charts
Double top charts are bearish reversal patterns in a prevailing uptrend. With a double top chart, you’ll see a brief pullback followed by an abortive rally, then a second pullback at the previous high, which then results in the price breaking down below the earlier low:
It’s easy to be lured into a double top pattern. Ideally, you’ll wait until the price drops below the first pullback low after retesting the top because this is when the formation is complete, and it’s the low point in the chart.
To calculate the price target of a double top pattern, you can either subtract the height of the formation from the point where support breaks. Or, you can analyze the ratio between the formation’s top and pullback low. If the formation’s top is 20 and the pullback low is 10 (2:1), then the price target for the breakdown is set at 5.
Double Bottom
A double bottom chart formation is what happens if you flip a double top formation upside down. The double bottom formation is a bullish reversal pattern in a prevailing downtrend. After hitting the bottom once, rising once, and hitting the bottom again, the double bottom occurs when prices break through the neckline to complete the ‘W’ formation.
Prices may rally to a recent high following a downtrend, then fall again to the level of the previous low, before rallying a final time to break out above the previous recent high to complete the formation and reverse into an uptrend.
To calculate price targets for double top highs, you can add the height of the formation to the breakout point. Or, you can analyze the ratio between the formation’s bottom and the first rally’s high. If the bottom of the formation is 5, for example, and the first rally reaches 10, then the price target would be 20.
Triple Top & Triple Bottom
Making the above formations even more complicated is that we can sometimes have triple top and triple bottom formations that look similar to double top and double bottom formations. Like double top/bottom formations, triple top/bottom formations are also reversal patterns. They go against a prevailing uptrend or downtrend.
As you can see here, the triple top formation consists of three equal peaks split by two valleys.
The triple bottom formation, meanwhile, is flipped upside down, consisting of three identical valleys and two abortive peaks.
To calculate the price target for a triple top or bottom formation, you add or subtract the height of the formation to or from the breaking point, similar to how you calculate price targets in double top/bottom formations.
Rounding Bottom
The rounding bottom or saucer bottom formation is a bullish reversal or continuation pattern. With this pattern, you’ll see a steeper cup or bowl formation than a cup and handle pattern. It’s similar to the head and shoulders pattern, but without discernible shoulders. You can connect low prices within the bottom to form a rounded shape representing the bottom of the saucer:
The formation first begins to form with selling pressure, causing prices to drop. This pressure eventually loses steam and transitions to an uptrend. Buying pressure subsides, causing prices to drop to a new low, and this trend repeats several more times until the lowest low is hit. Then, buying pressure takes over, eventually leading to a breakout and completing the rounding bottom formation.
To calculate short-term price targets for rounding bottom formations, you add the height of the cup to the resistance line.
Wedges
There are two types of wedge patterns, including rising wedge patterns and falling wedge patterns. These patterns can be continuation or reversal patterns depending on what markets were doing before the pattern formed.
In an uptrend, a rising wedge pattern indicates a bearish reversal. Markets are turning and prices are starting to drop. In a downtrend, a rising wedge pattern is seen as a continuation as prices continue to drop.
The falling wedge, meanwhile, is considered a bullish pattern. The falling wedge indicates a bullish reversal when formed in a prevailing downtrend, for example. When formed in a prevailing uptrend, the falling wedge indicates a continuation as prices continue to rise.
Rectangles
Rectangle patterns form when prices are bouncing between roughly equal highs and lows for a certain period of time. When drawing lines around the highs and lows of this period, you can see rectangles start to form.
The rectangle, also known as the trading range or consolidation zone, is a continuation pattern where the price ranges between parallel support and resistance lines. It’s an impasse where markets can’t really figure out what to do. During this impasse, the price will test support and resistance levels several times before breaking out. When the price breaks out, it will either reverse the previous trend or continue it (moving either upward or downward).
To calculate price targets during a rectangle formation, you add the height to the point of the breakout or breakdown.
Bilateral Patterns (Triangles)
Bilateral patterns consist of three different triangle formations, including symmetrical triangles, ascending triangles, and descending triangles.
Ascending Triangle
Ascending triangles are typically bullish continuation patterns in a prevailing uptrend. However, ascending triangles can also form as a reversal pattern in a downtrend. An ascending triangle pattern consists of two or more roughly equal heights and increasing lows. The resistance line is horizontal, although the extended support line slopes upward and convers with the resistance line, which is how the triangle is formed.
For an ascending triangle to form, each swing or low must be higher than the previous low. The formation is typically considered to be complete when the price breaks out past the upper resistance line.
To calculate the price target in an ascending triangle, you can add the height of the triangle’s basis to the breakout point. The stop loss should be placed at the most recent swing low.
Descending Triangle
The descending triangle is the opposite of the ascending triangle. Typically, it’s a bearish continuation pattern formed as prices continue to gradually drop over time as part of a broader downtrend. However, it can also form a reversal pattern during an uptrend. As with an ascending triangle, the price can occasionally break out upwards, which is why it’s important to play the pattern as it develops and use tight stops.
The descending triangle is formed as equal lows create a horizontal support line while decreasing highs create a downward sloping resistance line, creating the same type of right-angle triangle seen in the ascending triangle above.
To calculate the price target in a descending triangle formation, you subtract the height of the base of the triangle to the point where support breaks down.
Symmetrical Triangle
A symmetrical triangle, as you might have guessed, forms somewhere in between an ascending and descending triangle pattern. It’s a typical bilateral pattern where it’s difficult to determine the outcome of the pattern until a clear breakout has been confirmed.
With a symmetrical triangle, we’ll see a series of lower reaction highs and higher reaction lows, with the price eventually consolidating at a point. This point forms the tip of the triangle. The support and resistance lines, meanwhile, form the two sides of the triangle, eventually meeting at the point.
Since the breakout direction is difficult to determine, some traders will play both sides in a symmetrical triangle pattern, placing a long and short order, then closing one when the other hits.
To calculate the price target in a symmetrical triangle, add or subtract the base of the triangle to the breakout point. You can calculate a long-term price estate by drawing an extended trend line parallel to the support line (assuming the pattern breaks upward) or parallel to the resistance line (if the pattern breaks downward) passing through the other vertex of the triangle’s base.
Top Five Most Profitable Patterns for Bitcoin Traders
Certain patterns present a more powerful profit-earning opportunity than others. Historically, the following five patterns have given traders the best opportunities:
Triangles (ascending, descending, and symmetrical triangles)
Head and shoulders patterns
Double and triple top and bottom patterns
Cup with handle patterns
Flag and pennant patterns
Technical Indicators: How to Read Charts Like a Master
So far, we’ve focused mostly on broader chart patterns. Next, however, we’ll talk about technical indicators, including the signals that traders use to build their strategies.
Picture the broader chart patterns we discussed above as like the climate as it changes from spring to summer to fall and winter. We see the broader changes in the temperature, daylight, and weather throughout the year.
Technical signals, meanwhile, are the short-term information you read to predict which season is coming next. You might notice the temperature drop from 40 to 30 in a week, for example. This signals that winter is coming.
When analyzing technical indicators, it’s important to remember that any single technical indicator on its own is not particularly telling. You need context to understand what that technical indicator means. You can derive context by looking at information like a prevailing trend, chart pattern, and more. It’s like a piece of a jigsaw puzzle: it only makes sense when it’s all put together to create a coherent picture of the market.
Indicators can be categorized into overlays or oscillators:
Overlays: Overlays are indicators that use the same scale as the price and are plotted on top of the price chart.
Oscillators: Oscillators are displayed independently on a different scale below the price chart and will oscillate between a minimum and maximum value.
Certain technical indicators are considered leading indicators. A leading indicator has strong predictive qualities and can indicate the direction of the market before the price follows through. leading indicators can be effective in signaling an imminent change in trend or momentum before the market begins to show that change. The best-known leading indicators include the Relative Strength Index (RSI), Stochastic Oscillator, and On Balance Volume (OBV).
Other technical indicators, meanwhile, are considered lagging indicators. Lagging indicators follow market trends. They indicate a shift in market trends, but they tend to lag behind that shift. Typically, a lagging indicator is used to confirm a trend after a trend has already begun to emerge. However, lagging indicators have less valuable in a volatile market with no clear trend. The two best-known lagging indicators are Bollinger bands and moving averages.
Moving Averages
Moving averages are trend overlays that can indicate short, medium, and long-term trends. To calculate the moving average, we take the average price over a certain period of time. A moving average removes a lot of the ‘noise’ on the chart, including short-term volatility and price movements. It can make trends easier to spot.
There are two common ways to calculate moving averages, including simple moving averages and exponential moving averages. Both are considered lagging technical indicators.
A simple moving average (SMA) is just the sum of all closing prices over a particular time period divided by the number of periods. A 5-day SMA, for example, can be calculated by adding the closing prices for each day and dividing the sum by five. Over a longer time period, there’s greater lag. Longer scales smooth our price movements and tend to be less responsive than shorter time scales.
Check out the chart below to see how this works in practice. The 50-day moving average lags behind the price movements, while the 10-day moving average tightly hugs the price movements:
Exponential moving average (EMA), meanwhile, places greater weight on the most recent data points. This can ‘tighten’ the moving average to price movements, making the moving average more responsive to recent price movements.
Exponential moving averages use a weighting multiplier to give the most recent data points greater weight. This weighting multiplier can be calculated using the formula [2 / (Time Period + 1)]. In a 10-day EMA, the weighting given to the most recent price would be [2 / (10 + 1)] = 0.1818, or 18.18%.
There are also current exponential moving averages (EMAs), where you take today’s price x the weighting multiplier + yesterday’s EMA x (1 – weighting multiplier).
You don’t have to memorize these formulas. Charting tools apply these formulas automatically. However, it helps to know where these formulas are coming from.
Simple Moving Averages Versus Exponential Moving Averages
Simple moving averages and exponential moving averages are two ways to outline the same trend. One is not necessarily better than the other. They each have their own advantages.
An exponential moving average, for example, responds faster to recent price movements and hugs the price curve more closely.
A simple moving average, meanwhile, is ideal for identifying long-term support and resistance levels. The slope of the simple moving average is also used to gauge momentum towards a specific trend.
Typically, the 200-day simple moving average (SMA) chart and the 50-day SMA chart are the two most popular scales for identifying medium to long-term trends. These two charts are also useful for identifying support and resistance levels, bullish and bearish crossovers, and divergences.
When the simple and exponential moving averages come together, it creates a crossover. This is considered a pivotal event that could signal a trend change.
There are bullish crossovers, for example, which are also known as golden crosses. A bullish crossover occurs when the shorter scale moving average crosses above the longer scale moving average.
There are also bearish crossovers, also known as death crosses. A bearish crossover occurs when the shorter scale moving average crosses below the longer scale moving average.
Meanwhile, if the current price crosses above the long-term moving average, it’s indicative of a bullish breakout. If the current price crosses below the long-term moving average, it indicates a bearish breakout.
Moving Average Convergence Divergence (MACD)
Moving average convergence-divergence, or MACD, is a trend-following oscillator popular for gauging momentum. MACD takes two exponential moving averages (like the 12-day and 26-day EMA), then plots them against the zero lines to measure the momentum of a trend.
We also see the MACD histogram, which measures momentum based on the relationship between MACD and its signal line (the 9-day EMA of MACD).
A modern MACD oscillator indicator consists of four elements, including the MACD line, zero line, signal line, and MACD histogram:
MACD Line: The MACD line is the 26-day EMA subtracted from the 12-day EMA.
Zero Line: The zero line is the point where the two EMAs are equal.
Signal Line: The signal line is the 9-day EMA of MACD.
MACD Histogram: The MACD histogram is plotted as bars along the zero line. It’s the difference between the MACD line and the signal line.
A positive MACD occurs when the 12-day EMA is above the 26-day EMA. It indicates that the market is bullish. The higher the value, the stronger the upward momentum.
A negative MACD, meanwhile, indicates that the market is bearish, with lower values indicating strong downward momentum.
Pivotal events include convergence, crossover, and divergence from the zero line and the signal line.
Convergence: Indicates relenting momentum.
Crossover: Indicates a shifting of market forces.
Divergence: Indicates rising momentum.
Relative Strength Index (RSI)
Relative strength index, or RSI, is a way to indicate momentum. Momentum can identify the strength of market trends, giving you a good idea of when to buy or sell based on whether markets are overbought or oversold.
RSI oscillates between 0 and 100, with the typical timeframe being 14 days. When RSI is below 30, it indicates the market is oversold. When the RSI is above 70, it indicates the market is overbought. However, some traders use 20 and 80 as the boundaries instead, which can be more telling for highly volatile markets (including crypto).
Because RSI is a leading indicator, the slope of the RSI can indicate a trend change before that trend is observed in the general market. For that reason, RSI is one of the most common ways of analyzing market conditions.
RSI = 100 – (100/1+RS)
In this formula, relative strength (RS) equals average gain over the average loss (RS = Average Gain/Average Loss).
A gain is a period where the price closes above the previous day’s closing, while a loss is a period where the price closes below the previous day’s closing. These values are absolute, which means that losses are calculated as positive values.
Although RSI divergences can be helpful, they’re only helpful within the appropriate context. As with other indicators here, it’s an important reminder to avoid using any single indicator as a signal without proper context.
You can see a bullish divergence when the price hits a lower low and RSI hits a higher low. A bearish divergence, meanwhile, occurs when the price hits a higher high and RSI hits a lower high.
We can also use RSI to observe RSI failure swings, which are seen as indications of potential trend reversals in a bearish or bullish direction.
A bullish failure swing occurs when RSI falls below 30, bounces past 30, falls back, but does not fall below 30 and makes a new high.
A bearish failure swing, meanwhile, occurs when the RSI breaks above 70, falls back, bounces without breaking 70, and falls back to a new low.
Parabolic SAR (Stop and Reverse)
Parabolic stop and reverse (SAR) is an overlay lagging indicator based on the idea that price typically moves in parabolic curves when it’s trending. That’s why the parabolic SAR indicator is most effective in trending markets. SAR will stick close to price movements over time, falling below the price curve during uptrends and above the price curve during downtrends. Because of this nature, traders use the parabolic SAR indicator to set trailing stops and protect against losses.
There are separate formulas for calculating rising and falling SAR. The formula takes data from one period behind.
Rising SAR Formula: Current SAR = Last Period’s SAR + AF (EP – Last Period’s SAR)
Falling SAR Formula: Current SAR = Last Period’s SAR – AF (EP – Last Period’s SAR)
In these formulas, EP is the extreme point (either the highest high or the lowest low of the current trend) and AF is the acceleration factor. The acceleration factor is initially set to a value of 0.02, with AF increasing by 0.02 for each new high or low made by the extreme point.
When you increase the acceleration factor (AF), it increases SAR sensitivity, pushing SAR closer to the price curve. Lowering AF, meanwhile, moves SAR further away from the price curve. When you set AF too high, it can create too many whipsaws, creating false reversal signals.
SAR is best used in conjunction with the Average Directional Index. We’ll talk about the Average Directional Index next and how it’s used to determine the strength of a trend.
Average Directional Index (ADX)
Average directional index (ADX) has risen in popularity in recent years to become a preferred indicator for estimating the strength of a trend. As a lagging oscillator, ADX offers little insight into the future trend direction, although it does indicate the magnitude of market forces behind a trend.
ADX oscillates between 0 and 100, with ADX typically below 20 in a ranging market and above 25 in a trending market. An ADX above 40 indicates a strong trend.
When calculating ADX, we need to determine the positive directional indicators (+DI) and negative directional indicators (-DI), which together create the directional movement indicator (DMI). We calculate DMI by collating the highs and lows of consecutive periods.
+DI = (Smoothed +DM / ATR) x 100
-DI = (Smoothed -DM / ATR) x 100
In this formula, +DM is the high for the current period minus the high for the previous period. -DM is the low of the previous period minus the low of the current period. The ‘smoothing’ part of the equation, meanwhile, involves taking the average of the last 13 periods, adding the most recent value, and then dividing the sum by 14.
ADX also takes into account average true range, or ATR, which indicates volatility. True range (TR) is the absolute value of the greatest among three price differences (the current period’s high minus the current period’s low, the current period’s high minus the previous period’s close, and the current period’s low minus the previous period’s close.
ATR = [TR of Last 13 periods + Current TR] / 14
Directional Index (DX) = [(+DI – -DI) / (+DI + -DI)] x 100
ADX = [DX of last 13 periods + current DX] / 14
These formulas may seem complex. However, as mentioned above, you don’t need to memorize these formulas. There are plenty of tools that implement these formulas for you. If you want to be an informed technical trader, however, then it helps to understand where these formulas come from.
ATR offers no indication of trend direction. However, +DI and -DI do indicate trend direction. Traders can use ADX to determine the strength of the trend, then use crossovers of +DI and -DI to create signals that indicate potential reversals.
Let’s say, for example, the +DI line is crossing above or diverging upward from the -DI line with ADX above 40. This is a strong bullish signal. However, crossovers and divergences when ADX is below 20 are not signals of much consequence because there isn’t as much momentum behind these movements.
This chart explains how to read ADX within the context of parabolic SAR:
Fibonacci Retracement
Fibonacci retracement, as you may expect, is connected to the famous Fibonacci sequence or Fibonacci number. The sequence starts with the numbers 0 and 1, with each successive number in the sequence behind the sum of the two preceding numbers.
Fibonacci retracement in financial/crypto analysis, meanwhile, is a technical trading concept that identifies the extent of a corrective retracement after a rapid increase or decrease in prices. It seeks to quantify how much of a pullback we can expect after a surge or drop in prices.
In the Fibonacci sequence, the ratio of any number to its successor is 0.618, or 61.8%. This is the golden ratio, a number that plays a significant role in biology and mathematics.
Fibonacci retracement uses this same ratio to identify support and resistance levels. These levels are called alert zones, and they’re found at 23.6%, 38.2%, 61.8%, and 78.6%. Fibonacci retracement also has a 50% alert zone, which has nothing to do with the Fibonacci sequence but comes from Dow Theory, which theorizes that corrections typically result in a 50% retracement from the previous move. Retracement levels are drawn on a price chart after marking the high and low point of a trend.
Why are these numbers important? Well, a 23.6% retracement is typically seen in shorter timescales. A bounce from this level is less common if the correction has momentum. 38.2% and 61.8% retracements, meanwhile, are more likely to bounce (or reverse the trend). The 61.8% zone especially is known as the golden retracement.
Some analysts also use a derivative of Fibonacci retracement called the Fibonacci extension to identify how far a rally might go. Under the Fibonacci extension, zones can be found at 78.6%, 100%, 161.8%, 261.8%, and 423.6%.
Elliott Wave Principle
The Elliott Wave principle was created by American accountant Ralph Elliott in 1938. Elliott studied American markets for a decade during his retirement, then theorized that prices inevitably – and constantly – move in a fractal wave pattern. This fractal wave pattern is linked to natural laws, and you can outline the fractal wave using the Fibonacci sequence.
Elliott theorized that market prices moved in two types of waves, including impulse waves and corrective waves.
Impulse Waves: Impulse waves, also known as motive waves, move in the direction of the prevailing trend and consist of five smaller waves, including three trend-advancing or actionary sub-waves split by two corrective sub-waves.
Corrective Waves: Corrective waves that can be part of a larger impulse wave move against the direction of the prevailing trend and consist of three smaller waves, including two corrective sub-waves split by one actionary sub-wave.
This theory is known as the Elliott 5-Wave Pattern or the Elliott Wave Principle:
When combined together, an impulse wave and a corrective wave create 8 sub-waves to create the ‘5-3’ structure. This 5-3 structure makes up each Elliott wave cycle.
We saw this pattern in real bitcoin markets during 2018. This chart also shows prices holding at the 78.6% Fibonacci support level.
Fibonacci retracement levels and Elliott wave patterns are just two types of technical indicators that form a partial picture of crypto markets. When prices retrace to Fibonacci alert zones, it’s best to look at other indicators to see if your signals corroborate the reversal at these alert zones. If all of the signals are pointing towards a similar result, then you have a more informed view of the market.
Bollinger Bands
Bollinger bands trace their origin to American financial analyst John Bollinger, who developed the theory in the 1980s. Bollinger band analysis uses a moving average-based overlay to measure price volatility. The theory involves three bands, including a middle band to represent the simple moving average and an upper and lower band to represent standard deviations.
For the middle band, analysts typically use the 20-day simple moving average (SMA). The upper band, meanwhile, is the same SMA with two standards of deviation added, while the lower band subtracts two standards of deviation. Analysts can adjust the number of periods based on their trading preferences. However, analysts will use the same number of periods to calculate SMA that they use to calculate standard deviation.
The width of the Bollinger bands indicates volatility.
When the bands are wide, it indicates that markets are volatile and trending.
When the bands are narrow, it means volatility is dwindling and the market is ranging.
Approximately 90% of price movements occur within the Bollinger bands. When the price suddenly moves outside of the upper or lower band, it indicates a breakout could be upcoming.
During a strong uptrend in markets, prices tend to hug or move out of the upper band, for example, while during a strong downtrend, price activity is focused around the lower band. During market swings, the middle bands acts as a resistance for downtrend movements and a support level for uptrend movements.
Traders look for two crucial patterns within Bollinger bands, including double top (‘M top’) and double bottom (‘w bottom’) patterns. There are multiple variations of these patterns.
M Tops: M top or double top patterns occur in an uptrend and are indicative of a bearish reversal. In this formation, the price hits a point high above the upper band, then retreats below the middle band. The band moves up again but stops short of the upper band. When the second surge fails to reach the upper band, it signals a weakening trend and likely reversal.
W Bottoms: The W bottom or double bottom formation is what happens when the M top formation gets flipped upside down. It signals a bullish reversal. It starts with the price plummeting below the lower band, then rallying past the middle band before dropping again. During the second drop, the price does not touch the lower band, then rallies past the earlier swing high to break out into a bullish reversal, ultimately forming a W.
On Balance Volume (OBV)
On balance volume (OBV) is a volume-based oscillator and leading indicator. The signal quantifies volume, using cumulative trading volume to measure the strength of trends in upward or downward directions.
The idea behind on balance volume is that significant changes in volume often precede price movements, and that volume tends to be higher on days when the price moves in the direction of the prevailing trend. OBV adds volume during periods when the close is higher than the previous close, then subtracts volume during periods when the close is lower.
OBV technical analysis focuses less about the actual value of the volume. Instead, it looks at the rate of change or the rise and fall. This rise and fall, according to OBV theory, is what indicates the strength of buy and sell pressure. As OBV rises, it pushes buy pressure higher, leading to higher prices. When OBV is falling, it indicates a price decline is imminent.
We can seethe effect of OBV in action here, including the bearish divergence:
Analysts use the OBV oscillator to identify support and resistance levels, then look for breakouts that precede price breakouts. They’ll look at OBV diverging from the prevailing trend, for example, which could indicate an upcoming bearish or bullish reversal.
We see this effect in action in the next graph. We see the price make a higher swing high while OBV makes a lower swing high, indicating a weakening uptrend. In a similar fashion, when the price hits a lower low and OBV makes a higher low, the downtrend is losing steam, and a bullish breakout could be upcoming.
This is where analyzing your other trading signals can come in handy. You might notice OBV diverging from the prevailing trend, for example, then use your other signals to better inform your next decision.
Stochastic Oscillator
Stochastic oscillator is a leading oscillator that measures momentum, then uses that momentum to predict where markets will move next. The method was developed in the 1950s based on two key concepts:
Rule 1) Momentum always shifts before price
Rule 2) Variations in momentum can predict a change in market direction
With that in mind, stochastic oscillator analysis measures the relationship between closing prices over a given period as well as the trading range (high price and low price) of that period. Based on this relationship, the stochastic oscillator measures potential trend reversal, including overbought and oversold conditions.
The indicator oscillators between 0 and 100. These numbers indicate the bottom and top of the trading range over a specific time scale. That time scale is typically set to 14 periods.
The oscillator consists of two lines, including the slow oscillator (%K) and the fast oscillator (%D). Here’s how the formula breaks down:
%K = [(Current Period’s Close – Lowest Price of All Periods) / (Highest Price of All Periods – Lowest Price of all periods)] x 100
%D = 3-Period Simple Moving Average of %K
Values higher than 80 indicate an overbought market, while values lower than 20 indicate an oversold market. However, these numbers do not always indicate a reversal. During strong trends, the price can hover at these extreme ends of the range for a lengthy period of time.
Stochastic oscillator analysis can, however, indicate a reversal or surge in momentum in certain instances. When crossovers and divergences occur over and under the signal line (%D), it indicates a reversal and surge in momentum.
Stochastic oscillator theory is also based on the idea that closing prices tend to hover in the upper half of the trading range during an uptrend while hovering near the lower half during a downtrend. Analysts will look for crossovers at the midpoint to indicate a shifting trend.
Bullish divergences occur when the price hits a lower low while the oscillator hits a higher low. Bearish divergences, meanwhile, occur when the price hits a higher high while the oscillator swings to a lower high. These reversals can also be confirmed when the price breaks past the most recent swing high (in a bullish divergence) or the most recent swing low (in a bearish divergence). Both of these things can confirm the reversal.
When the inverse of these bullish and bearish divergences occurs, it creates what’s called a bull or bear set-up.
During a bull setup, the oscillator hits a higher high as the price hits a lower high. When the price swings to a lower high, market momentum continues to surge, and the price will likely rise even further.
During a bear setup, the oscillator hits a lower low as the price hits a higher low. In this situation, progressive downward momentum indicates that a continued upward surge is unlikely even though the price is diverging upwards.
There are two variations of the stochastic oscillator, including slow and full versions.
Slow Version: The slow version of the oscillator includes a smoothing formula. A 3-period smoothed SMA of %K is used to streamline the %K line.
Full Version: In the full version of the oscillator, the formula is fully customizable and traders can set custom lookback and smoothing periods as they like.
When checking stochastic oscillator analysis, you might also find something called StochRSI. This is a derivative of stochastic oscillator theory that applies the oscillator to the relative strength index (RSI) instead of the price. In that sense, StochRSI is a momentum oscillator of a momentum oscillator. StochRSI indicates the relative position of RSI with regard to its high-low range for a specific set of periods. You calculate StochRSI using the same formula as you would for stochastic oscillator analysis, except that you replace the price values with RSI values.
Spotting and Confirming Signals with Candlestick Patterns
Technical analysis works particularly well for developing medium and long-term insights. However, it can be more difficult when dealing with fewer trading periods and shorter time scales.
That’s why candlestick pattern analysis has become particularly popular for short-term traders in recent years. Candlestick patterns are used in conjunction with chart patterns and technical indicators to provide further confirmation for expected breakouts.
We explained the basics of candlestick charts up above. We told you how a candlestick pattern works, including what the body and wick of the candlestick means.
Candlestick pattern analysis is particularly useful because candlestick charts contain more information for a single trading period than any other type of chart. At a glance, you can see how markets performed that day based on the body of the candlestick, the size of the wick, and the relationship between the upper and lower wick and the body. Each candlestick tells you whether buyers or sellers were in control during that particular trading period and how other market forces competed against each other.
Learning to read candlestick charts can be one of your best skills to develop as a trader. Here are some of the features common in candlestick charts.
Single Period Patterns
Short Day
These candlesticks indicate uneventful trading periods. The candlestick tells us that the price moved very little from open to close during this period. It also shows us that the trading range – the spread between the highest and lowest prices during the day – was small. Regardless of the color of the body of the candlestick, this candlestick shows that bulls and bears are holding steady for this period.
Long Day
An intense trading session where the price moved significantly from open to close might look like the candlesticks above. The green candlestick shows that buyers dominated the session, telling us it was a bullish market. The red candlestick shows that sellers dominated, giving the market bearish momentum.
Spinning Tops
You may hear analysts talk about spinning top candlesticks. On these candlesticks, the wicks are relatively long. This is a neutral pattern regardless of the color of the body. With this pattern, the body of the candlestick is similar to a short day, although the shadows indicate a more significant trading range. Buyers and sellers both pushed the market at various points, although the session ultimately closed near to where it opened.
Long Shadows
The color of the body of this candlestick is not very important for this pattern. What’s more important is whether the body sits at the top or bottom. When the body is near the bottom with a long upper shadow, it indicates that buyers made an effort to push the market up, but strong selling momentum forced the price to settle back down low, signaling a bearish market. Conversely, when the body is at the top of the range with a long lower shadow (wick), it’s considered a sign of a bullish market. Sellers tried to take control, although strong buying momentum eventually pushed it near the top.
Marubozu
Marubozu means ‘shaven head’ in Japanese. A marubozu candlestick only has a body and there are no noticeable shadows (wicks) on either side. This candlestick occurs when the open and close of a session are close to the high and low. A green marubozu candlestick tells us that the session’s open equaled its low and the close equaled its high, which means buyers complicated dominated the session, signaling a bullish market. A red marubozu candlestick tells us that the session opened at its highest point and closed at its lowest point, indicating strong selling pressure throughout the period. The longer the body, the greater the momentum in either direction.
Hammer
A hammer candlestick pattern forms after a session of declining prices. The session closed near the top with no upper shadow and a lower shadow twice as long as the body. The hammer pattern indicates that buyers are starting to push back. It’s a bullish pattern regardless of the color of the body. The only requirement here is that the candlestick needs to close higher in green to validate the pattern.
Hanging Man
The hanging man candlestick pattern is identical to the hammer pattern at first glance. However, the hammer pattern becomes the hanging man pattern when it’s observed after a series of advancing prices. Just like the hammer, the hanging man can be either green or read. During an uptrend, the hanging man is seen as a warning: there was downward activity but buyers pushed the price up towards the end of the session. If the next candlestick closes lower, than the hanging man candlestick can signal a bearish reversal.
Inverted Hammer
An upside down or inverted hammer after a downtrend is considered a bullish reversal pattern but only if the next candlestick closes higher. This candlestick tells us the session ultimately closed near its opening price, although the upper shadow is an early indication that buyers are challenging sellers for the market.
Shooting Star
A shooting star is identical in appearance to an inverted hammer, but it forms in an uptrend instead of a downtrend, making it a bearish signal. Although the shooting star candlestick indicates further continuation of the uptrend (as shown by the long upper shadow or wick), the session ultimately closed near the bottom of its range, which indicates weakening upward momentum.
Doji
This is where we start getting into the weird and unique candlestick signals. A doji is a neutral cruciform pattern that indicates a state of near-equilibrium in the market. The session traded high and low, but ultimately closed exactly where it opened. With the doji candlestick, the upper and lower shadows may or may not be equal. Sometimes, the doji indicates relenting momentum or a potential reversal – say, when it forms next to certain other patterns.
Dragonfly Doji
The dragonfly doji candlestick pattern has a long lower shadow and no upper shadow, and the open and close are equal to the high for the session. When the dragonfly doji candlestick pattern forms in a downtrend, it’s considered to be a sign of bullish reversal.
Gravestone Doji
A gravestone doji has along upper shadow and no lower shadow, and the open and close are equal to the low for the session. The gravestone doji candlestick in an uptrend signals a bearish reversal. On both the dragonfly and gravestone doji candlesticks, the length of the shadow is a good signal of the momentum behind a reversal.
Multiple Period Patterns
Up above, we analyzed candlesticks based on a single candlestick for a single session. In most cases, however, candlestick analysis involves reading multiple candlesticks to discern a pattern. We’ll discuss some of the most common (and most useful) multiple period patterns below, including two-period, three-period, and five-period patterns.
Note: It’s important to note that many of these two-period patterns do not have to be directly adjacent to one another. They can occur in two subsequent trading sessions. Or, they can occur in close proximity to one another.
Bearish Engulfing
A bearish engulfing pattern is a two-period pattern that signals a bearish reversal when seen during an uptrend. The pattern starts with a short green body followed by a longer candlestick with a red body. It’s called an ‘engulfing’ pattern because the body of the second candlestick fully engulfs the first candlestick (although the shadows do not necessarily have to engulf).
Bullish Engulfing
A bullish engulfing signals a bullish reversal pattern in an uptrend. It’s a two-period candlestick with a short red body first and a second, green candlestick that engulfs the first.
Overall, engulfing patterns are some of the strongest indicators that we’re about to see a reversal. They not only indicate a shift in the movement of markets, but they also indicate a significant change in momentum.
Bullish Harami
Harami, interestingly enough, is the Japanese word for ‘pregnant’. It makes sense when you look at the two-period candlestick. A bullish harami forms in a downtrend when a long red candlestick is followed by a small green candlestick. The complete trading range of the latter candlestick needs to be within the body of the former candlestick (hence the ‘pregnant’ name).
Bearish Harami
A bearish harami consists of a large green candlestick fully covering the entirety of the red candlestick.
Harami patterns typically suggest relenting momentum after a strong trend. A harami is considered to be reversed only if the next candlestick closes favorably, which means it’s the same color as the second candlestick.
Harami Cross
A harami cross is a two-period pattern similar to a harami, except that the second candlestick is a doji (the cross image we discussed above), with the doji fully engulfed by the body of the first candlestick. The harami cross indicates weakening momentum or indecision in the market instead of a complete reversal. For this pattern to indicate a reversal, the third candlestick following the doji must be in concurrence.
If a harami cross forms in an uptrend, then the candlestick after the doji must close below the doji’s trading range in red. If it closes above in green, then it could mean the harami cross was simply a brief consolidation before the uptrend continues.
If a harami cross forms in a downtrend, then the candlestick that follows the doji must close above the doji’s trading range in green to indicate a bullish reversal.
Tweezer Top
A two-period tweezer top candlestick pattern forms when at least two candlesticks have even tops, regardless of their bottoms. When formed during an uptrend, the tweezer top is considered a potential reversal pattern. The candlestick tells us that the upper limit price has been repeatedly rejected at the same level, which suggests strong resistance at that level. As more candlesticks form even tops around these sessions, it provides greater evidence for resistance at that level. The reversal is confirmed by a bearish close in red below the midpoint of the first candlestick in the pattern.
Tweezer Bottom
A tweezer bottom is the inverse of the tweezer top: the bottoms of the candlesticks are even, but the tops are not. A tweezer bottom is a potential reversal pattern in a downtrend. When multiple candlesticks have even bottoms, it suggests that the market has repeatedly rejected the same low, which indicates strong support at that level. Bullish reversal is complete when the pattern is followed by a higher close.
With both tweezer top and tweezer bottom reversal patterns, only the tops and bottoms of the candlesticks’ bodies are used to validate the pattern. The shadows are not considered.
Dark Cloud Cover
Dark cloud cover is a two-period bearish reversal pattern in an uptrend. For this pattern to form, a long-bodied bullish candlestick is followed by a bearish candlestick that closes below the midpoint of the first candlestick’s body. The first candlestick must also close near the session’s low without a much lower shadow.
Piercing Line
Piercing line is a two-period bullish reversal pattern in a downtrend. It’s the opposite of the dark cloud cover pattern. For a piercing line to form, the long-bodied bearish candlestick must be followed by a bullish candlestick that closes above the midpoint of the first candlestick’s body. Dark cloud cover and piercing line patterns are similar to bearish and bullish engulfing patterns, although the momentum behind the reversal is less significant.
Morning Star
The morning star is the first three-period pattern on our list. it’s a bullish reversal pattern that is similar to the piercing line, but with a middle candlestick with a short body. A morning star pattern forms when we have a long red body followed by an uneventful red or green body and then a third candlestick that closes above the midpoint of the first candlestick.
Evening Star
The evening star is the inverse of the morning star pattern. It’s a three-period bearish reversal pattern that, like the morning star, is distinguished by the presence of a middle candlestick that has a short body. The evening star forms with a long green body followed by a short green or red body and a third candlestick in red that closes below the midpoint of the first candlestick. An evening star candlestick indicates a bearish reversal.
Morning Doji Star
A morning doji star pattern is similar to the two ‘star’ patterns above, but where the middle candlestick is a doji. The doji signals there was indecision among traders before the market eventually decided on a bullish reversal. For the morning doji star to form, the third candlestick must close above the midpoint of the first.
Evening Doji Star
The evening doji star candlestick pattern indicates a bearish reversal. The bearish reversal is complete when the third candlestick closes below the midpoint of the first, along with the doji in the middle.
Three White Soldiers
Three white soldiers is a three-period bullish reversal pattern indicated by three long green candlesticks after a period of declining prices. For the three white soldiers pattern to form, each candlestick in the pattern must close near the session’s high, with only a short or shaved upper shadow. Each candlestick in the pattern must also be bigger than or at least the same size as the first candlestick.
Three Black Crows
The three black crows candlestick pattern is a three period reversal pattern in an uptrend. The pattern includes three long red candlesticks, with each candlestick closing near the session’s low, with a small lower shadow. The second and third candlesticks must be the same size or larger than the first candlestick.
Rising Three Methods
Rising three methods is a five-period pattern that indicates a bullish continuation. The pattern is formed with a long green candlestick followed by three small red candlesticks contained within the body of the first. The pattern is complete when these four periods are followed by a final long green candlestick. The pattern shows that sellers tried to push back and reverse the trend, although prevailing momentum was not enough to complete a reversal. For the pattern to be confirmed, the fifth candlestick must close higher than the first, which confirms that the reversal attempt was not successful.
Falling Three Methods
The falling three methods pattern is the inverse of the rising three methods pattern above. It’s a five-period bearish continuation pattern that indicates there was some buying pressure, although it was not sufficient to overturn the prevailing downward pressure. The pattern forms when a long red candlestick is followed by three small green candlesticks contained within the body of the first and another long red candlestick. The fifth candlestick needs to close below the body of the first to confirm continuation of the downtrend.
How to Quickly Read Any Candlestick Chart: 3 Questions to Ask
Sure, you could memorize all of the candlestick patterns above – and there’s nothing wrong with that. But it’s a lot to memorize.
We have a better idea. You can analyze a lot of candlestick charts simply by answering three simple questions:
What Was the Preceding Trend? This tells you if there is a trend that can be reversed, or if markets are wavering without any clear direction (which makes it difficult to perform accurate analysis).
Where Did the Last Session Close Relative to Its Trading Range? A close near high is bullish, while a close near low is bearish. Longer shadows indicate significant price rejections.
How Large Was the Candlestick’s Body Compared to Adjacent Candlesticks? Candlesticks with larger bodies than surrounding candlesticks tell us there was relatively greater momentum for that period, suggesting a major shift from open to close. A candlestick with a small body after a strong trend, meanwhile, suggests that there was relenting momentum, respite, or indecision in the market.
The answers to these three questions can give us strong signals of what markets will do next. In a declining trend, a long-bodied close near the top of the session’s range indicates a strong likelihood of a bullish reversal. In a rising trend, a long-bodied close near the session’s low indicates a bearish shift in the market.
Disadvantages of Candlestick Analysis
Candlesticks pack a lot of information into a simple symbol. However, they’re not perfect.
Candlesticks do not describe the chronological sequence of price action during the session, for example. We know where the session opened and closed and what the high price and low price were for that session. However, we don’t know if the session plummeted at the open, skyrocketed, or flip-flopped throughout the day. A line chart lets us see how a particular session played out from open to close.
Of course, you can adjust the time frame of your chart to get a more accurate idea of how markets performed during a specific period of time.
Applying Candlestick Pattern Analysis to Real Markets
Candlestick patterns sometimes tell us the story of a market, but not always. Let’s take a look at a real-world market to see if we can use candlesticks to identify some trends.
This is a chart of BTC/USD:
The chart shows that the relative strength index (RSI) stops breaking down just above 40 during the second week of November. It enters overbought status within a week, then steadily surges for a month.
RSI stays overbought for weeks, suggesting that a bearish reversal is imminent. However, there’s no indication of a reversal despite the fact that sell pressure is virtually non-existent.
In the second week of December, the price hits a new high, although RSI diverges to a lower high. Next, we see confirmation of sell pressure when an evening star candlestick pattern forms.
If you look closely, however, there’s a doji star between the star and the last candlestick in the pattern. For certain patterns, candlesticks do not necessarily need to be adjacent to one another. The doji is neutral and indicates that the markets were indecisive. During these scenarios, we can merge two candlesticks, the star, and the doji, and the result is still a star.
The last candlestick in the chart closes significantly below the midpoint of the first candlestick’s body. When we consider this signal in conjunction with bearish RSI divergence, it indicates strong bearish momentum getting ready to hit the market.
Thus, the trader performing the candlestick analysis might take a short position here and stop at the most recent high. We don’t know if the head and shoulders (H&S) pattern here is going to be completed. However, despite several brief rallies, RSI continues to diverge bearishly. All signs are pointing towards a bearish turn, so you stick with your short position.
By the time the second week of January arrives, the H&S top pattern has formed. The surge in volume breaks the neckline of the pattern, further confirming the trader’s position. The stop can be moved to the most recent swing high within the pattern to cover the trader’s profits.
Top 6 Ways to Trade Bitcoin: Useful Crypto Trading Strategies Types
We’ve told you about the different patterns and strategies available to you, but there are plenty of different ways to execute these trading strategies:
Micro Trading or Scalping
This trading strategy involves using small price movements to accumulate profits throughout the day. A scalper typically uses a 5 or 15 minute chart, then identifies a local range and trades based on candlestick patterns. With informed candlestick analysis and a little bit of luck, a talented scalper may be able to earn a profit. Nevertheless, micro trading or scalping is very risky, and a single bad trade can undo a day’s worth of profit.
Day Trading
Day traders identify the potential range of the trading day using various indicators, then capitalize on price fluctuations. A day trader typically uses an hourly chart to set the entry and exit positions. Day traders can use candlestick patterns, momentum indicators, and volatility indicators to inform their trades.
Swing Trading
Swing trading is a short to mid-term trading strategy where trades last anywhere from a few days to a few weeks. Swing traders identify local support and resistance levels within a short-term trading range, typically during a consolidation spell. Then, they make trades based on the highs and lows within this range and their analysis.
Position Trading
Position trading is the type of trading activity where you hold (or hodl) a position over a set period of time. You’re not trading at all, but instead investing in an asset based on your analysis. A position trader’s analysis can include fundamental analysis and weekly or monthly chart viewing with the goal of earning long-term profits.
Margin Trading
Margin trading is popular among day traders and swing traders. Margin traders use leverage borrowed from an exchange or broker to increase the value of their trades by anywhere from 2x to 100x. Essentially, you’re betting on the price going up (long) or down (short) within a certain period of time. This is the only type of trading on this list where it’s possible to lose more money than you invested, making margin trading vary risky. Of course, profits are also multiplied by the ratio of leverage. It’s a high-risk, high-reward type of trading.
Algorithmic Trading
Algorithmic trading or automated trading involves using software programs – like trading bots – to execute trades based on pre-specified criteria. You might buy trading algorithms from a marketplace. Or, you could create your own algorithm based on trading signals, using things like volume, range, moving averages, and momentum to equip your bot to make the best possible trades.
Top Ten Technical Trading Tips
Trading cryptocurrency is easy. Actually making a profit from trading cryptocurrency, however, can be difficult. Here are our ten favorite tips for new and advanced traders alike:
Spend More Time Studying Charts: Most traders – especially beginners – don’t spend enough time studying charts. If you want to perfect your ability to analyze markets, then you need to become a competent chart reader.
Take Advantage of Paper Trading: Today’s biggest exchanges offer paper trading, letting you play with fake money before you start trading the real thing. Implement some of your strategies and analysis to see how you perform.
Trust the Trend: After reading the technical analysis tips above, you might assume that most signals indicate a reversal in a trend. However, trends are trends for a reason, and you should never bet against the trend in a trending market unless you see multiple confirmations of a reversal.
Stop-Loss Orders Are Amazing: Even the most experienced traders can watch their positions get liquidated as markets take an unexpected turn. When markets turn unexpectedly, stop loss orders are your best friends. Use trailing stop loss orders to protect profits you have earned.
Avoid the Beginner’s Luck Trap: Many rookie technical traders get some early beginner’s luck, then assume they’re the greatest technical traders in the world. Experienced technical traders, meanwhile, are smart enough to never become complacent. Avoid getting too high or too low while trading no matter the outcome.
Greed Kills: This tip builds off the tip above. Many capable traders fail to retain their profits simply because of greed. Why sell now when I can sell next month and make twice as much? That sounds good – until markets drop and wipe out all of your profits. Set your targets, stick to them, take your profits, and wait for the next opportunity.
You Don’t Have to Make Every Trade: Sometimes, a trade just doesn’t feel right. Maybe your analysis isn’t giving you a clear signal. In some cases, you might just want to avoid making a trade. Be patient and know which hill to die on.
Diversifying with Altcoins Isn’t Really Diversifying: Some crypto fanatics will recommend diversifying your portfolio by buying altcoins. Unfortunately, bitcoin is still the king of the crypto markets, and most altcoins simply follow in its wake. In many cases, altcoins move in lockstep with bitcoin. Never lock all your funds into crypto.
Unregulated Markets Are Dangerous: Crypto markets are still largely unregulated and uncontrolled. Despite what crypto enthusiasts say, a large amount of crypto volume is linked to illegal activity. Crypto trading is risky for all sorts of reasons.
Your Profit Might Disappear with a Single Bad or Hacked Exchange: You might be the world’s best technical trader. You might have tripled your investment in a single day of trading. Unfortunately, those profits mean nothing if you leave your private keys unsecured. Make sure you are in control of your private keys, and never leave more than you can afford to lose on an exchange.
Bitcoin Chart Trading Analysis: Final Word
Finally, from our trading pioneers (who helped engineer this user guide) to all of our sincere peers, we hope this premiere bitcoin trading guide is career-changing. Yes, knowledge is power but taking massive action on what you absorbed above is one of the best remedies for losing fear (uncertainty and doubt too) as adhering to a new frontier and atmosphere such as the cryptocurrency market can be a game changer for those who apply and implement the right strategies and tips outlined.
Any trader of bitcoin or digital asset investor who made it this far into our crypto chart analysis review is bound to have learned multiple methods that will optimize your results of how bitcoin trading and cryptocurrency chart analysis works.
Happy trading!
Aziz, Master the Crypto Founder
I’m Aziz, a seasoned cryptocurrency trader who’s really passionate about 2 things; #1) the awesome-revolutionary blockchain technology underlying crypto and #2) helping make bitcoin great ‘again’!
The post Bitcoin Chart Analysis: How to Trade Bitcoin Using Charts appeared first on Master The Crypto.
A two-part Bitcoin IRA guide on how bitcoin retirement accounts work and a review of the 9 best cryptocurrency-centric individual retirement account company providers on the market in 2019.
Bitcoin IRA: How to Add Bitcoin to A Retirement Account
Bitcoin can now be added to your retirement account in America. Yes, crypto IRAs are officially here.
Today, we’re explaining everything you need to know about how bitcoin IRAs work, the pros and cons of adding bitcoin to your retirement account, and the most trustworthy bitcoin IRA custodians on the market.
What is a Bitcoin IRA?
First lets clarify, a bitcoin IRA is a self-directed individual retirement account (IRA) that holds investments in bitcoin. A traditional IRA holds precious metals, stocks, or bonds.
Internal Revenue Service (IRS) regulations do not specifically allow you to hold cryptocurrency in an IRA. However, the Internal Revenue Code does not specify which assets self-directed IRAs can hold as investments: it only specifies which assets you cannot hold. Bitcoin is not an excluded asset, so it’s perfectly legal to hold bitcoin in your IRA.
The IRS has not excluded any cryptocurrencies from being held in IRAs. This means you can have bitcoin in your IRA, but you can also have Litecoin, Ethereum, Ripple, or whatever other cryptocurrencies you would like to invest on.
How to Add Bitcoin to your IRA
Most individual retirement accounts (IRAs) in America are managed by custodians or trustees on behalf of investors. The bank or broker-dealer, for example, holds stocks, bonds, mutual funds, and certificates of deposits in the investment vehicle.
However, some Americans choose to have self-directed IRAs. With a self-directed IRA, you can add different investment assets. You can hold real estate, promissory notes, tax lien certificates, gold, private placement securities, and even bitcoin in your self-directed IRA.
There’s no such thing as a Bitcoin IRA per se, just as there’s no such thing as a Gold IRA or a Stocks IRA or any other types of asset class-specific IRAs. All of those are marketing terms that hold zero practical significance. Under the law, there is only the IRA.
Here’s the basic process of adding bitcoin to your IRA:
Step 1) Open a self-directed IRA through an IRA custodian
Step 2) Find a bitcoin IRA facilitator or buy bitcoin yourself from an exchange
Step 3) Fund your self-directed IRA via a rollover or transfer
Step 4) Hold bitcoin in your IRA until you’re 59.5 years old (or pay a penalty to withdraw your bitcoin early)
Your self-directed IRA has the same regulatory requirements as an ordinary IRA. You cannot access your money until you are 59.5 years old or else you face a penalty for early withdrawal.
Plus, with a self-directed IRA, you are in charge of your own investment decisions.
For many people, adding bitcoin to the IRA gives them some much-needed diversification. Some believe bitcoin gives their portfolio the highly-desirable “alpha”. Bitcoin isn’t tied to the economic success of one specific country, for example, nor is it tied to real estate prices, gold, or other assets. It moves in its own ways for its own reasons, and that’s why some investors are happy to add bitcoin to their portfolio.
For clarity, the IRS clarified that cryptocurrencies were treated as property for tax purposes in a notice issued in 2014. As of that announcement, Bitcoin enthusiasts got the green light to proceed with confidence knowing that the IRS viewed their asset-of-choice as personal property — similar to shares of stock — which ultimate allows cryptocurrencies to be included in IRAs.
The specific procedure for opening a bitcoin IRA varies between providers. One major company has partnered with BitGo as its digital wallet and security provider for crypto retirement assets, for example. The company uses BitGo’s institutional custody service to hold customers’ bitcoins. If you want to access your bitcoin, then you’ll need to complete government-issued identification and voice verification.
Pros and Cons of Adding Bitcoin to your IRA
There are advantages and disadvantages of adding bitcoin to your IRA. Advantages and disadvantages include:
Pros
Diversification: Bitcoin moves independently from individual markets, economies, and currencies. It can add much-needed diversification to your portfolio. It could even insulate your account from huge losses during a downturn.
Limit the Effects of Inflation: Bitcoin has a fixed total supply, which means it is not subject to artificial inflation. Billions of US Dollars are printed every year, which is why the value of 1 USD gradually drops over time.
Cut Out Banks: With bitcoin IRAs, you can avoid relying on banks to manage your money (although you still need to rely on a self-directed IRA custodian).
Avoid Capital Gains Tax and Enjoy Tax-Free Growth: Holding bitcoin in your IRA insulates your bitcoin from taxes. You won’t pay 15 to 20% capital gains tax on any profits you make from holding bitcoin.
Easy Bitcoin Purchasing: When buying bitcoin in your IRA through a bitcoin IRA service provider, you don’t go through a traditional exchange interface. Instead, you file an order with the custodian, and the custodian buys bitcoin on your behalf. It’s an easy process that does not require you to sign up for an exchange, complete additional KYC verification, or manage your own wallet.
Built-in Custody Solution: With a bitcoin IRA, the IRA custodian holds your bitcoin. They are the custody solution. You don’t have to trust an exchange to hold your money, nor do you have to worry about your own wallet or private key management.
No Minimum Investment Limits: Some bitcoin IRA firms have minimum investment limits, while others do not.
Cons
Initial Setup Fees: Self-directed IRAs come with their own fees. Setting up a $50,000 self-directed IRA account for trading can cost as much as $6,000 in fees for the initial setup, for example. Fees vary between providers. Bitcoin IRA services, however, are particularly costly because there are few providers in the space.
Custody and Maintenance Fees: You don’t just have to pay to set up your self-directed IRA; there are also recurring custody and maintenance fees charged by self-directed IRA providers.
Transaction Fees: In addition to all of the fees above, you still need to pay costly fees per transaction. Most bitcoin IRA providers charge a fee of around 3.5% per transaction for each purchase and 1% for each sale. Put into exchange terms, you’re paying 3.5% taker fees and 1% maker fees, which is 10x to 30x more than you pay on an ordinary exchange. Some bitcoin IRA providers charge purchasing fees of 5%, while others charge $150 per sale.
Premature Withdrawal Fees and Taxes: If you decide to close down your self-directed IRA and withdraw your money before age 59.5, then you’ll pay additional fees. You might also have to pay capital gains tax. Avoiding capital gains tax was the main reason you set up a bitcoin IRA in the first place.
Minimum Investment Limits: Some bitcoin IRA providers have minimum investment limits of $10,000 to $30,000.
You’re Still Relying on Financial Service Providers or Middlemen: There’s no real way to open a self-directed retirement account in the United States without a middleman or financial services provider. You still need a custodian for your self-directed IRA. Some people like bitcoin because it provides ‘true freedom’ from the current financial system. With a bitcoin IRA, you’re still tied to the financial system in some way.
You May Not Be in Complete Control of your Private Keys: One of the best parts about bitcoin is that when you’re in control of your private keys, you’re in control of your money. With a bitcoin IRA, that’s not necessarily the case. Key management policies vary between companies, but typically at least one key is held by your IRA custodian.
Cumulatively, all of the fees can quickly negate the tax advantages of an IRA. You’ll pay 15 to 20% capital gains tax on bitcoin today, and you can avoid that tax with a Bitcoin IRA. However, after paying all of the fees listed above, you might not come out ahead in the long run. Some providers charge 10% to 25% initial setup fees, for example, which can instantly negate any initial tax savings.
Overall, bitcoin IRA fees are extremely high right now. Bitcoin is trendy, and there are few providers in the space.
However, that may change in the future. Institutional players like Fidelity are entering the space, and it’s possible for fees to plummet.
As soon as industry giants like Vanguard or Fidelity get involved in the bitcoin IRA space, it will become much more affordable to hold bitcoin in your IRA.
Is a Bitcoin IRA Legal?
The IRS doesn’t specifically endorse holding bitcoin or other cryptocurrencies in your IRA. In fact, the IRS doesn’t specifically approve any investments as IRA investments.
Instead, the IRS has a list of excluded assets that cannot be held in your IRA.
In a 2014 ruling, the IRS clarified the tax status of bitcoin. Since then, the IRS has treated bitcoin as non-currency personal property, which means it’s similar to stocks. You pay capital gains taxes every time you sell.
What’s the Difference Between a Bitcoin IRA Provider, a Custodian, and a Custody Solution?
When searching for bitcoin IRA information online, things can quickly get confusing. People start talking about IRA ‘facilitators’, self-directed IRA custodians, wallets, and other agencies.
Typically, getting a bitcoin IRA requires dealing with three different agencies:
Bitcoin IRA Services: Bitcoin IRA services are considered ‘financial conduits’. These are the agencies you deal with when you want to add bitcoin to your IRA. Most bitcoin IRA services are not regulated by the SEC like traditional banks or IRA custodians.
Self-Directed IRA Custodians: Self-Directed IRA custodians hold assets in your individual retirement account. Unlike with a traditional IRA, a self-directed IRA lets you hold assets like real estate, gold, and cryptocurrencies. Self-directed IRA custodians include banks, credit unions, and other entities.
Custody or Wallet Providers: Most bitcoin IRA services have partnered with a specific wallet or custody solution. This is the agency that actually stores your bitcoin.
Who Holds My Private Keys with a Bitcoin IRA?
One of the best parts about bitcoin is that you’re in complete control of your money. As long as you have your private keys, nobody else can touch your money no matter what happens.
That’s not the case with a Bitcoin IRA. Companies have different procedures for private key management, but you will not be in full control of your private keys with a Bitcoin IRA.
One major bitcoin IRA provider, for example, creates three unique private keys when setting up a bitcoin IRA:
One key is stored with the wallet provider (like BitGo)
Another key is given to the IRA custodian
A third key is given to a startup company (keytern.al) that provides recovery services if your key is lost or damaged
All of these keys are stored off the internet in cold storage locations.
How Much Do IRA Service Providers Charge?
IRA service providers charge enormous – even ridiculous – fees for their convenience. One of the biggest players in the space is called Bitcoin IRA. They charge 10% to 15% upfront fees.
On top of that, the self-directed IRA custodian may charge its own setup fees. All IRA custodians also charge ongoing maintenance fees – typically around 1% per year on the total value of your assets.
Other companies charge fees as high as 25%. These fees are more common when investing in alternative cryptocurrencies.
Can I Create a Bitcoin IRA Without a Bitcoin IRA Service Provider?
Yes! You can certainly create a self-directed Bitcoin IRA without using a bitcoin IRA service provider. These companies speed up and simplify the process, but you can certainly create a bitcoin IRA without their help.
Just talk to a lawyer to get started. You may need to set up an LLC to buy the cryptocurrency, then select an IRA custodian. Visit an exchange, find a secure wallet, and you’re set.
Today, a growing number of law firms specifically advertise cryptocurrency IRA services. The fees are often much cheaper than bitcoin IRA service providers.
FAQs About Bitcoin IRAs
Where is My Bitcoin Stored? With a self-directed Bitcoin IRA, the custodian typically controls your bitcoin. The custodian is responsible for the custody of your bitcoin. That’s why you pay maintenance fees and setup fees.
What is an IRA Custodian? The IRA custodian is the institution in charge of your self-directed IRA. The custodian is licensed and regulated by the IRS. Most custodians are banks, credit unions, or trusts, although some providers are considered ‘non-bank custodians’.
Does the IRS Consider Cryptocurrency to Be a Retirement Asset? The IRS doesn’t specifically list which items can be included in your self-directed IRA, but they do list which items cannot be included in your IRA. Cryptocurrency isn’t mentioned in IRS retirement savings regulations at all, but cryptocurrency is still technically allowed in your account.
Is My Bitcoin IRA 100% Safe? The safety of your bitcoin IRA depends on the trustworthiness of your custodian. Some custodians are FDIC insured, which means the value of your account is protected up to a certain limit (say, $500,000). You can protect your account further using two-factor authentication (2FA) and a secure password.
What About Other Cryptocurrency IRAs? You can hold bitcoin and any other cryptocurrency in your self-directed IRA. In fact, you can hold virtually anything in your self-directed IRA – as long as it’s not on the IRS’s specific list of exclusions. Today, major bitcoin IRA providers also offer Ethereum IRAs, Ripple IRAs, Litecoin IRAs, and IRAs for other major cryptocurrencies.
How Can I Find a Bitcoin IRA Custodian? There are thousands of self-directed IRA custodians across the United States. You can find certain bitcoin IRA custodians on the IRS-approved nonbank trustees and custodians list. From that list, contact different custodians to ask about their services, fees, securities, procedures, and more. Be aware that some cryptocurrency IRA companies only work with specific custodians. If you want to work with a specific facilitator, then you may need to work with their specific custodian.
Bitcoin Retirement Account Overview
Depending on your retirement goals, a bitcoin IRA may be the right solution for you. As more cryptocurrency-centric service providers enter the space, it will become easier and cheaper to open a bitcoin IRA.
As cryptoassets has exploded with growth, so too have cryptocurrency investment options.
With so many different crypto IRA providers from which to choose, it can be difficult to know which one will offer the best services. Next, as a part two of this Bitcoin individual retirement account guide, let’s cover the best 9 cryptocurrency IRA companies and compare how they work and what they offer as custodian providers.
Best Bitcoin IRAs and Crypto IRA Companies
Today, we’re listing the best bitcoin IRAs and crypto IRA companies in the most factual, unbiased way possible.
Broad Financial
Minimum Investment: $0
Broad Financial offers two core products, including Self-Directed Bitcoin IRAs and Solo 401(k)s with Checkbook Control. From the Broad Financial dashboard, investors can buy virtually any alternative asset allowed in an investment account – including bitcoin and other cryptocurrencies. There’s no minimum investment amount required.
Unlike certain other companies listed here, Broad Financial doesn’t use a third party custodian: they are the custodian.
Another nice thing about Broad Financial is that the company doesn’t charge asset-based fees. Some other companies here charge fees of 1% per year on your total asset value, which means your savings slowly get chipped away over time. With Broad Financial, you pay flat-rate fees instead, making this an attractive option for all levels of investors.
Broad Financial offers both Traditional IRAs and Roth IRAs. Plus, you get to choose the cryptocurrency exchange you want to use. And, you get to use the digital wallet of your choice.
We also appreciate the transparent fee structure. While other Bitcoin IRA companies listed here refuse to disclose their fees upfront, Broad Financial displays their fees publicly on their website. You’ll pay a flat-rate fee of $1,295 to set up your account, for example, instead of the 15% to 25% charged by other bitcoin IRA companies.
Overall, Broad Financial is one of the more trusted providers in an industry with lots of sleazy competitors.
BlockMint
Minimum Investment: $10,000
BlockMint is one of the top options among bitcoin IRA companies. The company frequently appears at the top of lists of best bitcoin IRA services. BlockMint is backed by Lear Capital, which has been one of the biggest names in the precious metals IRA space for 20 years. The main ‘catch’ is that you need to invest at least $10,000, although other bitcoin IRA options on this list have higher minimum investment requirements.
Most BlockMint customers have good things to say about the company. They claim the company has good customer service and an easy-to-use exchange interface. Experts are patient and knowledgeable with customers whether this is your first time buying crypto or you’re a seasoned expert.
In exchange for that high level of customer service, BlockMint’s customers pay hefty fees. You’ll pay 15% fees when buying cryptocurrency, for example, although small discounts are available based on volume.
You also need to meet the minimum investment amount of $10,000 for each type of coin. You cannot buy $7,000 of BTC and $3,000 of ETH to meet the minimum investment amount of $10,000, for example; you need to buy at least $10,000 of each type of coin.
You’ll also pay fees to BlockMint’s custodian, which is New Direction IRA Services. The company charges $200 per year as an annual storage fee along with an administration fee of $450 to $725 per year based on your account balance and the number of cryptocurrencies held.
Bitcoin IRA
Minimum Investment: $5,000
Bitcoin IRA was one of the first bitcoin IRA companies in the industry. Launched back in 2016, Bitcoin IRA is a Sherman Oaks, California-based financial services provider specializing in setting up bitcoin IRAs for clients. You pay fees of 10% to 15% at setup, then ongoing fees of 1% to the company’s IRA custodian. In exchange for those fees, you get all-in-one, hassle-free service from people who are experts at setting up bitcoin IRAs.
Technically, Bitcoin IRA doesn’t directly provide any actual bitcoin IRA services: the company just acts as a customer service hub. They connect exchanges, crypto wallets, and IRA custodians together with investors.
Bitcoin IRA originally used Kingdom Trust as its IRA custodian. In 2019, however, Bitcoin IRA partnered with BitGo Trust to store crypto holdings for customers. Bitcoin IRA’s retirement account with BitGo Trust is insured for $100 million. Plus, customers can diversify their holdings into 12 different digital assets while paying 30% lower wallet fees.
Bitcoin IRA benefited from the first-mover advantage in the crypto space. The company began offering crypto retirement accounts in 2016, quickly growing to a client base of more than 5,000 hybrid crypto IRAs. Since 2016, Bitcoin IRA has processed over $300 million in digital asset transactions. Overall, the company claims to be the largest bitcoin IRA company in the space, and we see no reason to doubt that claim.
First Digital IRA
Minimum Investment: $20,000
First Digital IRA lets you invest in BTC, ETH, or XRP through your IRA. There’s a minimum investment of $20,000. First Digital IRA has partnered with Kingdom Trust Co. to be the custodian for digital IRA customers.
Other advertised benefits from First Digital IRA include “tax-free growth”, “security”, and “diversification”. First Digital IRA also claims to take care of the entire process of setting up a bitcoin IRA from start to finish. That includes the process of creating a self-directed IRA account with a custodian, buying bitcoin, and storing bitcoin in a wallet.
Like other shadier bitcoin IRA providers listed here, First Digital IRA refuses to disclose its fees upfront. You have to request a guide to see how much it costs. Typically, this means the fees are on the high end, even costing as much as 10% to 25% just for acting as a middleman. That’s a significant chunk of your initial investment wiped out in unnecessary upfront fees alone.
Coin IRA
Minimum Investment: $30,000
Like Bitcoin IRA, Coin IRA is a facilitator company, which means they don’t actually provide wallet, exchange, or custodial services: they just connect investors with these services, acting as a middleman while enhancing the user experience.
If you’re new to cryptocurrency and don’t mind paying a premium for convenience and customer service, then Coin IRA is one option. The company promises to give customers freedom from banks while helping them secure their money in a tax-deferred account. Customers’ funds are insured in “hacker-proof” cold storage.
Like other bitcoin IRA providers listed here, Coin IRA is a subsidiary of an existing precious metals IRA company. Specifically, Coin IRA is a subsidiary of Goldco, which is based in Woodland Hills, California.
BitIRA
Minimum Investment: $20,000
BitIRA is a relatively new crypto IRA provider launched by Birch Gold Group. The company distinguishes itself from the competition by ensuring assets against theft, fraud, hacks, and even mistakes. That gives investors an extra layer of security – particularly investors who want to invest in crypto but are worried about the risks.
BitIRA holds customer funds in cold storage in a guarded vault, similar to most other custody solutions here. BitIRA also claims to take care of the entire process for you, letting customers enjoy high tax-free growth with minimal fees or risk.
That all sounds good, but a closer look reveals some issues with BitIRA. The company’s website is filled with awkward testimonials and headshots from Peter Thiel, Bill Gates, and Eric Schmidt, making it seem like they all endorse this company. In reality, these three have nothing to do with BitIRA. BitIRA is also just a third party middleman: the company takes a cut of your investment in exchange for connecting you with a wallet and custodian.
One of the biggest issues we have with BitIRA is that the company refuses to disclose its fees upfront. When asked about custodial fees, the company simply responds, “fees for every account will vary”. We assume BitIRA charges fees as high as 10% to 25% just for operating as a middleman between you and an IRA custodian.
Noble Bitcoin
Minimum Investment: $20,000
Noble Bitcoin is an offshoot of Noble Gold Investments, a precious metals IRA firm. The company aims to help anyone diversify their IRA or 401(k) with bitcoin and digital currencies. Today, you can buy BTC, ETH, LTC, and XRP directly through Noble Bitcoin while enjoying the advantages of a Bitcoin IRA.
Other promised benefits with Noble Bitcoin include an efficient IRA rollover process, a customer-first approach, and 25 years of experience handling precious metals IRAs for customers.
Noble Bitcoin and its parent company Noble Gold Investments are based in Pasadena, California. The company offers limited information about its products, services, or fee structure upfront, although customers can request a free guide to learn more.
Regal Assets Bitcoin IRA
Minimum Investment: $5,000
Regal Assets lets customers invest in BTC, LTC, XMR, XRP, and ETH through an IRA. There are two introductory package options available, including the Merchant Package ($5,000 investment required) and the Knighthood Package ($10,000 investment required). For those willing to invest more money, there’s also the $50,000 Knightshop Portfolio, the $100,000 Dynasty Portfolio, and the $250,000 Coronation Portfolio.
Regal Assets claims its experts are available to chat 24 hours a day, 7 days a week. However, there’s an overall lack of transparency with how Regal Assets operates, including its fee structure and other information you want to know before sending your money to a company.
Bitvest IRA
Minimum Investment: $0
Bitvest IRA is one of the shadiest bitcoin IRA companies in the space today. The company’s website looks like it was designed in the 1990s. The company also makes absurd promises, claiming you can buy bitcoin for your IRA “with no commissions”. The Bitvest IRA website is also filled with random testimonials and headshots from investors like John McAfee, James Altucher, and Mike Novogratz despite the fact they have nothing to do with this company.
In any case, if you’re willing to take a risk with a shady company, then Bitvest IRA is one option. The company claims to have formed a strategic partnership with Madison Trust Company, which they describe as a “government approved and regulated, chartered trust company” and “a leader in offering IRS approved self-directed retirement services.”
Madison Trust Company is a New Jersey-based self-directed IRA provider, while Bitvest IRA (also known as Bitvestmint LLC) is based in Boca Raton, Florida.
13 Things to Look for in Bitcoin IRA Company
Bitcoin IRA companies are relatively new, and it can be hard to separate good bitcoin IRA companies from bad ones.
Fortunately, we’re here to help. Here are 10 things we look for when analyzing today’s bitcoin IRA companies.
Initial Setup Fees: Some IRA custodians charge initial setup fees as high as 15% to 25%. If you buy $100,000 of bitcoin today, then that means you’re paying fees of $15,000 to $25,000. Sometimes, you’re better off paying the capital gains taxes!
Maintenance Fees: Many IRA custodians charge annual maintenance fees. With some companies, these fees are a flat rate of, say, $100 per year. Others charge fees based on 1% to 3% of your asset value, which can quickly erode your savings and any gains.
Other Fees: On top of the initial setup fees and maintenance fees, some IRA companies charge even more fees. Some companies charge “administration fees”, for example, reducing your savings even further. Some of the companies listed above charge administrative fees of 1% of your asset value, for example, which means your retirement account will drop in value by 1% every year if all else stays the same. These unnecessary fees chip away at your earnings and reduce growth.
Facilitator Companies Versus Custodial Companies: Some bitcoin IRA companies don’t really do anything except act as the middleman. Bitcoin IRA, for example, doesn’t provide wallet services, nor does the company act as an IRA custodian: Bitcoin IRA is just a middleman that charges a 10% to 15% fee for connecting an investor like you to wallet and custodian services. Some investors are willing to pay a premium for good customer service, while others are not.
Multiple Crypto Purchase Options: Some bitcoin IRA providers only allow you to buy bitcoin for your IRA. A growing number, however, now allow you to purchase ETH, XRP, and other major cryptocurrencies. Some even allow you to buy 12+ cryptocurrencies for your retirement account.
Security History: Does the bitcoin IRA company have a strong security history? Do they use state-of-the-art security procedures to safeguard accounts? Have they partnered with reputable third-party banks and storage providers?
Login Protection, Withdrawal Protection, 2FA, Etc.: Does the IRA company protect your account against unauthorized login attempts? Does 2FA safeguard your account against unwanted intrusions? Login protection helps your crypto investments stay in your account.
Insurance: Many bitcoin IRA providers now insure their funds against losses, theft, and hacks. Insurance is good for two reasons. First, it shows an insurance company was sufficiently impressed by the company’s security procedures to provide a policy. And second, it means customers like you are safeguarded against losses.
Account Setup Process: How quickly can you set up an account with the bitcoin IRA provider? Does the company take days or weeks to respond to your request? Or do they work with you 24/7 to set up an account quickly?
Access to Crypto Holdings and Private Key Management: Who holds your private keys with your bitcoin IRA? Some bitcoin IRA providers give multiple parties access to your private keys for additional security. Others trust you to manage your private key.
Transparency: The bitcoin IRA space is relatively new, and that means there are plenty of shady companies out there willing to take your money while charging excessive fees. Most good bitcoin IRA companies disclose their fees and terms upfront. Some companies, however, refuse to disclose any information about how cryptocurrencies are stored, who their custodial partner is, or how much customers are charged in fees. This is information you need to know before sending thousands of dollars to a bitcoin IRA provider.
Withdrawal Fees: Some IRA custodians hold your money hostage, charging excessive fees if you ever want to close down your account. Make sure you understand any withdrawal fees if you plan to rollover your IRA, withdraw your bitcoin, or close down your account.
Customer Ratings: Most bitcoin IRA companies are new, which makes it hard to find trustworthy customer reviews online. We checked reviews for all of the companies listed above, although we took all reviews with a grain of salt.
Final Word
The bitcoin IRA space is relatively new, and the industry is filled with shady providers. While the first two options on our list (Broad Financial and BlockMint) seem to provide good service at a reasonable price, most other companies on our list charge excessive fees with little reason.
Fortunately, there are other options:
Contact an attorney and set up a bitcoin IRA yourself. An attorney can help you set up an LLC, create a self-directed IRA, and maximize your tax-deferred bitcoin savings.
Wait for more reputable providers like Vanguard and Fidelity to enter the space (both are rumored to be launching bitcoin investment accounts in the near future).
No matter if you are an investor, trader or work to earn bitcoin, looking into a BTC IRA is a smart choice to do. We will continue to update our user review guide on Bitcoin IRAs as well as researching all of the top cryptocurrency individual retirement account companies to give you the best break downs and benefits of each available.
Aziz, Master the Crypto Founder
I’m Aziz, a seasoned cryptocurrency trader who’s really passionate about 2 things; #1) the awesome-revolutionary blockchain technology underlying crypto and #2) helping make bitcoin great ‘again’!
The post Bitcoin IRA: Top Crypto Individual Retirement Account Companies appeared first on Master The Crypto.
The ability to trade bitcoin within an emerging cryptocurrency market asset class is nothing short of amazing.
Trading has always been known as the life blood of marketplaces. And the blockchain-based Bitcoin era has brought with it new challenges that traditional, on-the-floor stock traders never faced given the 24/7/365 on-all-the-time nature of the crypto industry. The bitcoin trading trend has no end in sight, so let’s begin.
Learning how to use the best bitcoin trading bots of 2019 will not be easy nor will instant profits flow in right away. However, awareness is the first threshold key to unlock in order to optimize for the smartest trades.
We recommend reviewing each of the 15 auto-trading bot systems below to start with today.
The following bitcoin trading bot rankings used these components as criteria to help rate and review:
easy to setup, install and use properly – also ability to make changes fast (without super technical skills)
pricing and cost flexibility (free trials, monthly, annual or lifetime license options)
type (cloud-based, windows / macOS / Linux, automated 1-click trading feature)
external signals (via TradingView or other third-party indicators etc)
number of active positions (how many open trades at any given time)
coin diversity (how many different tokens are available to trade)
company reputation, product history and overall longevity
customer support and service accessibility (plus software system upgrades)
Once these characteristics are evaluated per platform, identify which are your most favorable strategy execution features of your liking and start examining in full. Start small, use tolerable amounts when setting up any automatic cryptoasset trading bot based in bitcoin. Last thing any hands-off semi-auto pilot trader wants to experience is performing bitcoin trades at a loss, especially without your knowledgeable ‘consent’ that manual transactions inherently possess (also known as setting and forgetting gone wrong).
Humans, aka investors and traders, are full of biases and prone to emotional reactions (aka FOMO, FUD).
This puts bitcoin buyers and sellers in a minor disadvantage at times, leading to miscalculations and jeopardizing trade results due to over analyzing sentiments and ‘trending’ cryptocurrency news.
Crypto-related platforms are all gearing up for the ‘high-frequency-trading’ boom in the budding bitcoin sector. When combined with the non-stop price volatility movements, it can be frustrating for day traders to compete globally or continuously with any peace of mind, especially if any real amount of money is at stake. To make it tougher; the borderless, permissionless, peer to peer market never sleeps or gets turned off ‘after-hours’. This can become a highly stressful situation for investors to exist in. Master The Crypto’s guide on the best bitcoin trading bots list hopes to help see how each stacks up bit by bit, bot by bot.
The benefits of using a bitcoin bot to execute trades is pretty straightforward. They enable 24/7 exchanging, quick executions, removes human error and emotion, provides diversity and even a testing playground to practice putting your bot money on the line in live markets. Of course, as many know, sometimes you have to take the good with the bad. These bots may provide a digital leg-up advantage, but offer their own risks like low quality software, set and forget fear, poor strategies, failed stop-loss limits executed or overall scamy schemes promising ‘guaranteed gains’.
In their infancy, they were not the greatest choice to trust large amounts of money with but they have come a long way since then. Trading bots can now be considered highly sophisticated and have all manner of functions for your comfort level and needs. The top software systems available can give investors a legitimate edge by trading on their behalf, with specific parameters set up, thereby optimizing the time, effort, and resources of the human involved. Whether thinking of your personal bitcoin trading bot being akin to your artificial assistant, there is only one of two options to choose from; DIY, aka build your own, or use a preprogrammed bot. It’s time to focus on the latter and see what the bitcoin market has to offer in the growing world of automated crypto trading bots.
Que the development of trading bots, the programmable robots designed to enable around the clock trading morning, noon and night.
Top 15 Bitcoin Trading Bots of 2019
Here we break down the top choice of trading bots for 2019, unmasking why they work and how they are programmed including their use of risk tolerance, timeframes, and considerations of the investor about a particular coin. We also include as much relevant information as we can (like costs, if readily available).
Haasbot
Hassbot is one of the more popular automated trading solutions and can also integrate with all major exchanges. It is regularly used by the financial gurus who teach others about cryptocurrency (something that always results in the best secrets of the trade being kept to themselves- like trading bots). It operates 24/7, can identify candlestick patterns in trading recognition, and can be bought as a three month at a time use.
Since the inception of HaaSOnline Automated Investment Software in January 2014 conception by Stephen de Haas, the software has had 2 major revisions and third is about to release this year. The updated version has been reviewed and is not able to connect to every major platform but they are working on a solution to that now.
The bot is supported on Windows, MacOS, and Linux but requires 1.2 GHz or higher, as well as 4 cores, at least 2GB of memory space, and a super fat internet connection (5mbit download speed) to function properly. HaaSOnline does offer 15 different bots to choose from though, based on how often you want to trade and the range offers many ways to personally configure preferences. Because they offer so many different kinds of systems, there is something for everything. However, the price being between .12 BTC and .32 BTC per three months use, we recommend this one only for users who are committed to extracting significant use from the bot itself. Otherwise, it’s just not worth the price.
3Commas
3Commas is a popular, easy to use bot that supports BitFinex, Bittrex, Bitstamp, Binance, GDAX, KuCoin, Poloniex, YoBit, Huobi, and Cryptopia. It adds new exchanges all the time and allows you to access all of them at the same time from a convenient platform. Although based in Toronto, a majority of it appears to be run from Russia with Russian based employees. You can see about a dozen employees listed, along with their LinkedIn profiles, on the website and the company itself has a very active social media account.
The platform boasts a smart trading terminal with portfolio management tools, allowing for personalization. There is a “trader’s journal” that keeps track of all your trades across different exchanges in one easy to see location and you can set up trade types on platforms that normally do not allow that type through this service. The bots even allow you to do multiple trades simultaneously. Probably one of the more cool features is the ability to follow and copy someone else’s trading style. So if you see someone who’s trading abilities you admire, you can trace them and follow suit with one easy click- and that’s just the tip of the iceberg.
To see what their dashboard looks like, you can set up an account with your email and a password for free. Monthly subscriptions for trade and bot use range from $30 to $100 a month, depending on what it is you are looking for, including a starter, advanced, pro, and enterprise package that you can purchase in 1 month, 6 month, and yearly intervals. There is a 0.25% commission fee but it is only charge on the money you deposit directly into your 3commas account, not with the individual exchanges, and there is a $10 signup bonus.
All of 3commas can be access through a web browser on desktop or mobile but iOS has an app available and they are currently working on one for Android.
Cryptohopper
CryptoHopper is a crypto trading platform based on the cloud technology, meaning it can make trades for you even when your computer is off. There is a setting allowing for third-party trusted sources to determine what signals the bot should look for which is useful for newer traders. Experienced traders have over 120 indicators and candle patterns to choose from as well as over 30 signal groups from around the world to create a unique trading approach matching the style you wish to use.
Cryptohopper has created a reputation for itself as a reputable, quality trading platform with features like trading designer strategy, automatic robots, copy trading, and its own trading marketplace. For those who are uncertain of their skills, they also offer “paper trading” which simulates the real markets but does not use real money. This allows you to practice as much as you want/need before stepping in with real cash.
Founded in 2017 by two brothers, he main goal of CryptoHopper is to make advanced automated trading simple, a goal it appears to have reached, and is based in Amsterdam. Like some other bot platforms, it allows you to access multiple exchanges from one place but what separates them is their lack of fee for doing so. It can connect to the top 12 exchanges around the world.
We recommend this platform specifically because of its ease of use, “training” program, and its ultimate control giving to the user without any push in one direction or another. Their monthly subscriptions range from $19 to $99 a months, depending on the features you want and the budget you have, including the explorer hopper, adventurer hopper, and hero hopper packages. If you’re still not convinced or are nervous, they do offer a free 7-day trial for anyone who signs up.
Gekko
Gekko is a unique trading bot in that it is entirely programmable and is available on GitHub as a completely open source. It supports 18 major exchanges and offers an adaptable plugin system to integrate with IRC, Telegram, and emails.
Overall, Gekko is meant for users who value simple automation and optimization to execute basic trading strategies. They have a web interface that allows for inputting historical data and live data, calculate indicators as well as profit/risk metrics, simulate markets and order execution, and graph results for ease of understanding. It also features viewing coin prices in real time and executing live orders.
It’s not an overly abundant service and has limited functionality, but it’s also simply and easy to understand. Gekko gets the job done and is not only useful but completely free.
Gunbot
Gunbot is one of the most popular automated bitcoin trading systems available today, with some touting its extensive customization options and others describing its ability to keep novices and advanced users happy.
This platform allows users to connect to just about every popular exchange (with each update adding more) and is one of the few with the trading tools available to completely customize your bot’s trade technique. Its popularity brings with it a large and active community as thousands of people using it daily. Any problem you might come across with the software will most likely have forums directing you how to solve it.
Gunbot is desktop software and can run on PC, Mac, Linux, or a VPS. It comes at three price points ranging between 0.04 BTC and .3 BTC. Your purchase includes lifelong updates and you can get a lifelong license for between 0.035 BTC and 0.165 BTC.
CryptoTrader
Cryptotrader is a fantastic but not well known platform. It is a cloud-based trading bot that allows traders to build their own customizable trading bot solution in minutes and does not require installation of software whatsoever.
A unique feature of this platform is their strategies marketplace, where you can buy and sell successful strategies. Cryptotrader even allows for back testing strategies on past market data. It also supports all major cryptocurrency exchanges and uses a multitude of coin types, not just Bitcoin.
The cost is between 0.0026 BTC and 0.0316 BTC on a monthly basis (although they also accept Litecoin).
BTC Robot
BTC Robot guarantees profits with a self-described automated trading tool and is one of the earliest trading bots to be commercially available. What separates them from other platforms also claiming to be the best is they actually have evidence supporting this and claims to it works by constantly analysing prices across all Bitcoin exchange markets in order to exploit the gaps.
Their set up is simple and user-friendly, but have a track record of mixed reviews. Some claim regular small returns but others have stated it is difficult to get it to work properly and does not generate a significant ROI.
Despite this, it is a safe bet to at least try because they are backed by a 60-day, 100% money back guarantee.
Zenbot
Zenbot is an open source, anonymous trading bot that is currently under active development and in its third iteration. It’s completely free but does require some knowledge of its code because it allows for personalized editing through Github.
The bot works with a lot of cryptos and can execute multiple trading strategies. It’s also one of the only autonomous trading solutions that is even capable of high-frequency trading and supports multiple trading at the same time. They boast the capability of a lot of features but do not recommend its use if you want to trade large amounts.
Coinbot.club
Coinbot.club is a crypto bot rental service with an open source code. One of the best things about this company is just how overly transparent they are. The website has a description of algorithms used (including their Conservative Algorithm and Aggressive Algorithm), info on the team, and a link to their Github page: https://github.com/coinbitbot.
The sheer amount of features is a point of pride and part of what makes them one of the most popular automated Bitcoin trading bots on the market today. They have three types of bots, and three bonus modules; the social analyser module that analyses information on various social media sites for info relating to your choice of crypto and does so through human team members, the arbitration bot that scans for opportunities across various exchanges, and the telegram assistant which allows you to execute trades over a familiar platform interface. All three are customizable.
It is important to remember that they have a multi-tier commission program so if you get sent a link from a friend talking about how great it is, they may not be being completely forthcoming because they would make money if you sign up through them.
Overall, Coinbot.club puts a special emphasis on community and transparency that is alluring. As an industry about personal gain and typically valuing anonymity, it makes for a nice change that they make a point of proclaiming and acting in a way that is opposite. They also distinguish themselves by promising to offer real profits and losses, sending out an alert if the bot has made a loss of -10%.
If you’re interested but unsure, they do baost a 7-day free trial. You can register for a test the bots free of charge as long as your trading volume does not exceed 0.001 BTC. This makes it a great option iof you wish to get a feel for what you would be in for upon actual purchase.
Margin.de (Formerly Leonardo)
Margin.de is a trading bot platform put out by Margin and is made with integrated parts that it bought from a previously shut down trading bot by the name of Leonardo. Their emphasis is in security, clean layouts, and effective bots, and the site shows a significant level of transparency.
This is a once pay system with the starter package being $89 and the professional plan being $1,699. It supports a surprising amount of exchanges and it allows payment options from multiple sources (Visa, MasterCard, PayPal, and BitPay).
They arguably have the most attractive and clearly invested a lot into the appearance of the interface. You can also find a comprehensive FAQs section on the website and a multitude of online tutorials.
Autonio
This bot claims to be the first completely decentralized trading app that is powered by AI. Because of this, Autinio’s source code can be checked and verified by any user.
Autinio is marketed to both novice and professional users with a lot of customizable options to make a trading style you want for your bot. However, they also have a marketplace where you can buy someone else’s.
The platform’s app is on the Ethereum Blockchain and uses its own ERC-20 token called NIO. You can purchase NIO tokens on major exchanges like Bitfinex, Ethfinex, and others, as you will need them to trade on the app.
As of October, the app has over 3,000 daily active users and is available for download on Windows, Mac OS, Linux, and Android. The subscription price is currently $50 per month.
Zignaly
Zignaly is an incredibly new bitcoin trading bot, still in its beta stage, and currently only supports Binance and allows users to directly execute trading strategies. It best feature so far is no limit on trading pairs (other platforms cause you to pay more to have access to more).
The website also offers a lot of transparency, including links to the co-founders’ social media profiles. Currently it is free but when there is an official release, it will have a cost and they will have added more exchanges.
Reviews are good so far so keep an eye out for the future release of its main platform!
Profit Trailer
ProfitTrailer has a modest amount of transparency but does not list it’s creators on the site at all. Despite being formally registered in Curaco, the headquarters and employees are actually in the Netherlands and claims 3,000 users worldwide.
This bot is capable of “trailing trends,” allowing users to jump on the latest trends faster with less risk. But what makes it particularly unique is its wiki. The wiki has plenty of how-to pages, with the support team talking the time to create 50+ videos showing people extensive uses. It’s one of the many things that inspires users to leave good reviews.
Features for this platform include (but are definitely not limited to) over 20 buy and sell strategies, help for beginners, portfolio overview, multiple exchanges and hundreds of cryptos, notifications tracker to Telegram and Discord, and many more. Subscriptions come in 1 month, 3 month, 6 month, 9 month, and 1 year intervals, ranging in price from €39 to €89 a month. All subscription types give you access to all exchanges and 24/5 support. They also offer a service where you cn buy a VPS (virtual private server).
ProfitTrailer is available on Windows, Mac OS, and Linux. You can download the software and use it on any internet-connected device.
Pro Crypto Bots (Goldman Bot)
Unfortunately, Pro Crypto Bots offers a significant lack of transparency. The website has no about us page and it is not clear who is running their service or from where, although the name is registered in Toronto. The only clues to its legitimacy comes from online reviewers and its biggest online name connection comes from the brokeback packer.
According to the site, the platform uses Fibonacci trading bots to give users “incredible opportunities to grow your crypto investment with minimal risk, even during volatile market conditions,” and attempts to dazzle with stories of users gaining enormous returns after implementing their trading strategies even if prices go down.
The bots themselves were allegedly created by anonymous user @Fibonacci30, with one for ETH/USD that operates on a 2 hour timeframe and another for BTC/USD that operates on a 4 hour timeframe. Both are fully automated and take place only through Bitmex and Deribit. Because of this, it is not available in the United States as those two exchanges are banned (some online users suggest using a VPN to get around this).
Their features include easy set-up, runs through amazon web services instead of on your computer, offers a discord support group, is encrypted, claims large returns, and can buy/sell futures. All it requires is a Bitmex or Deribit account, Bitcoin (they suggest a minimum of .5 BTC but it’s not required), and a PayPal to sign up for the subscription. There is only 1 package and it costs a staggering $350 a month, payable only through PayPal.
Overall, the limited information on the company and the platform makes it difficult to obtain a full understanding of Pro Crypto Bots. However, they do offer a free 14-day trial and your Paypal will not be charged if you cancel before the 14th day. The lack of transparency is unusual for such an expensive service so proceed at your own risk.
Crypto World Evolution (CWE)
CWE is listed just to show you how quickly these bitcoin trading bots can ‘wear out’. Crypto World Evolution, once considered a top tier system with a large membership and active users, has had quite a fall from grace in the auto-crypto trading bot space. It’s biggest appeal was the amount of individual control you have over what it trades and how – even to individual coins of your choice. While it only used bitcoin in its trading orders, it did have the option to select up to 15 different coins to trade within and essentially try to profit via ‘microbetting’, or microselling and microbuying.
The trades this bot did were on average worth .01 BTC so if you select a limit of .1 BTC then it’s possible the bot will open 10 trades at once to meet this limit. Trades remain “pending” until the desired level is reached or until you press sell yourself (again, leaving you with ultimate control). Now, in late 2019, this bitcoin trading bot seems to have faded into the oblivion and needs to be checked up on before any careful consideration of using the auto trading bot software to ensure it is up to date and functioning properly.
Back during its peak, on average, trades looked to close at around 2% but it can be seen closing at 1-10%. Because markets are volatile, it could make several trades a day or none at all. It really just depends on what it sees as worthy which means you can sit back and relax instead of constantly watching the up and down. While you can use any trade platform with this bot, we recommend Binance for now because their API is allowing for choice of altcoin more freely to trade against your Bitcoin. However, as noted, please access their latest version of the bitcoin trading bot portal to give it a good gut-check questioning before using. We will update the review on CWE trading bot software once more intel comes back to us.
More Bitcoin Trading Bots to Review
The 15 most popularly used bitcoin trading bots are listed for further review and guidance. However, there’s more coming soon.
Apex Trader Automated Trading Platform (works on Binance and KuCoin)
SuperOrder Automatic Cryptocurrency Trading Bots (works on BitMEX)
Quadency Smart Crypto Asset Trading and Management (works on over 10 exchanges)
Kryll
Shrimpy Universal Crypto Trading and Portfolio Management App (all major platforms)
HodlBot Cryptocurrency Trading Bot (lightweight, easy to customize)
How Humans Compare to Auto Crypto Trading
Going inside cryptocurrency’s new warfare on the bitcoin trading battlefront can be daunting as trading bots are essentially special programs using complex indicators to analyze the condition of the market, predict its next move, and execute trades. Sounds complicated, right? But let’s take a look at the ups and downs of this new avenue of trading.
The Downside
Scams- in the early days of trading bots, most were just scams and this can put a damper on any party.
Hidden Fees- not all is as it seems, some services have extra fees tacked on to a monthly subscriptions.
Updates- keeping up with updates is something that is made fun of online because people do not like to do it, but in this case it is vital to keep the software updated so the bot can stay relevant to market changes.
Limitations- depending on the bot you choose, it may not be factoring in breaking cryptocurrency news, analysis, insider knowledge, or more that a human would.
Pattern matching- this is when a trading bots’ operational algorithm becomes identified, making them potentially less profitable.
Artificial Intelligence- AI is still limited and struggles to replace human experience and instinct.
The Upside
Efficiency- human error does not exist in these bots, their speed and ability to avoid mistakes makes them highly profitable.
24/7- this market never sleeps but humans have to, a bot can cover you without having to stressfully be apprised of as much as possible as often as possible.
Intuitive Algorithms- machine learning algorithms can quickly factor in many things, including social media, to determine the best investment opportunities.
Lack of Emotion- means lack of impulse buying or otherwise emotionally driven choices that human would make, especially ones based in fear.
Personalization- while keeping constant track of markets worldwide, you can also program your bot to look out for key indicators that you have preference for via easy to use interface buttons.
Other Key Points Worth Noting:
Institutional bots are designed to reduce problems associated with market manipulation and crypto volatility.
Traditional crypto bots comprise of largely automated systems that are designed to perform actions such as real-time information exchange, fiat-crypto trades, resolution of customer queries etc.
In an ideal world, you may want to consider using bots that combine the automatic system with human expertise. For example, eToro offers the CopyTrader tool that lets you copy exact trades that other traders make. It is more of a trading bot working with the help of a human trader.
Even so, they continue to evolve at all times, and their functionality and sophistication are constantly increasing. New ones are appearing all the time, and there are dozens of them on the market right now, waiting to be used. They can be free, or subscription-based. Such bots can even be quite expensive and are often used by professional traders. Still, they are all usable, and can even be quite profitable.
While there are numerous benefits of using trading bots, users should remember that there are some serious second-thought risks involved as well. After all, you are giving the control over your money to a third party. Trading bots are still a new technology that has yet to develop. Not only that, but they work with cryptos, which are only a few years older tech than the bots themselves.
One of the biggest risks involves flawed software. Not all of the bots are of equal quality, and bad coding can make a lot of damage. If you decide to trade large amounts through the bot, the risks are that much bigger. Of course, flawed software is not a purposeful defect, but it can cost you a lot of you use a bot that has it.
There are also Flash crashes that you should watch out for, as you can experience quite heavy losses if you fail to set stop-loss limits. Flash crashes can be quite often, and it is highly advisable to be on a lookout for such occurrences.
Finally, we should not forget about scams. Scammers are a curious breed, and they evolve with technology and market. As soon as trading bots emerged, scammers figured out how to use them to their advantage. They started creating fake trading bots that the traders would start using, give them their money, never to see it again.
How Important are Trading Bots to the Bitcoin Market?
Cryptocurrency is absolutely a new tech that’s fast becoming the darling of the world. Even more, it is increasingly becoming a live laboratory procedure for trading at a higher frequency, as well as an area for the advancement for trading bots.
While there has been a vast number of trading bots and algos used by Wall Street companies for conventional trading disciplines, cryptocurrency markets are now seen as a new trading platform for exploring new methods and employing some marketing strategies.
his has been confirmed by Forbes which reported that the development of tools or trading software and decentralized exchanges will herald a new era of automated trading bots.
While companies are increasingly working on different software for crypto trading, it is still a sector that guarantees lots of improvements which will be revealed by the continuous expansion that artificial intelligence provides.
While the future of exchanges and blockchain tech is still not really clear, it is becoming increasingly obvious that artificial intelligence will play a large role in the near future.
Professional traders and institutional investors will need them to help curtail the risks while executing high volume trades in a semi-automated or hands free way.
Trading bots effectively help with minimizing trading limitations and makes it easy for retail investors, to efficiently use simpler tech applications through a well secured process. In fact, these trading bots can be designed to take advantage of trade inconsistencies caused by some manipulation, thus helping an investor or trader make even more money.
Trader bots with artificial intelligence, will also help improve the ease of trade monitoring as well as investment portfolio. As a result, traders can then focus on growing their portfolio thanks to the reliable and predictable returns.
Also, traders using bots are more likely to eliminate all forms of human error from their trades. In fact, last year, lots of traders made a lot of fortune from using trading.
The Long Term Effects
These days, experienced traders make use of advanced trading tools as conventional traders are not familiar with them. As it stands, there is a common API for crypto trading, which makes it more challenging to use bots. Ironically, most of them don’t perform well when it comes to low volume trades.
The volatility of the cryptocurrency market necessitates the need for trading bots which are becoming increasingly popular among traders. These programmable software algorithsm allow investors to remain in trading at all times, with the bot making automatic bids even while the trader is asleep and the other half of the world is just starting to wake and rise.
While crypto trading bots sound amazing, there is a need for due diligence if it involves automatic software since human alone is not infallible when it comes to matters of trading. Even Warren Buffet, a seasoned Wall Street legend loses out from time to time and crypto trading bots could be useful at making sure such investors stay ahead of others.
Nevertheless, their continuous use in trading comes with huge costs. In the end, it is certain that bots will continue to be improved upon to meet the varieties of trading needs. This will be even more so when the crypto industry stabilizes, as they’ll play a role in helping developers with AI’s deep learning capabilities.
Last Automatic Bitcoin Trading Bot Thoughts
There you have it – we will do our best to update with on-going research about the latest and great bitcoin trading robots. As fast as the FinTech and virtual currency worlds are growing, a lot can change in a short amount of time.
As innovation and insight begin to stack up and showcase strengths in all kinds of transformative and disruptive ways, there will be a lot of hog wash with the bacon. But just like the meat isn’t the key, protein is where the solution lies. No matter what list you stumble upon and read up on next, never invest more than you can risk to lose as many cryptocurrency related laws, rules and regulations are yet to be handed down by the alphabet governing bodies.
One last thing to remember regarding the trading bots is that they are, and should be seen and used as, tools. They are not a passive income solution that will make a profit for you while you’re doing something else just because of the buzzword automated. Of course, you can set up specific parameters on some of them, and have your trading somewhat secured, but the market is growing and changing all the time, and your parameters need to follow these changes especially as daily crypto news and cycles continue.
Because of that, you cannot just set up a bot and forget about it. They still require your supervision, and often even interference. The right strategy is also important, and if you do things right, then the trading bots can turn out to be quite profitable tools. If you don’t — expect some serious losses.
In closing out this piece, it is worth remembering that unlike humans, commercial robots are never swayed by emotions or other psychological factors that are known to influence a lot of traders. With that being said, they don’t call the intellect “man’s greatest asset” for nothing. Happy trading everyone
PS: contact us with any feedback or suggestions and get ready for the bitcoin halving where many credible BTC price predictions could come true. The unique, one-of-a-kind timeframe bitcoin is in may prove to be the perfect time to start using an automated crypto trading bot for capitalizing on the next bull market cycle.
Accept Bitcoin Payments: Top 14 Merchant Gateways To Use
Read More
Spend Bitcoin: Top Places Accepting Crypto Payments in 2020
Read More
Bitcoin Futures Guide: Best Exchanges + How Trading Works
Read More
Bitcoin Scams: Bitcoin Hacks, Theft and Exit Scams History
Read More
Bitcoin Price Today: BTC/USD Exchange Rate Value Guide
Read More
Bitcoin Chart Analysis: How to Trade Bitcoin Using Charts
Read More
Aziz, Master the Crypto Founder
I’m Aziz, a seasoned cryptocurrency trader who’s really passionate about 2 things; #1) the awesome-revolutionary blockchain technology underlying crypto and #2) helping make bitcoin great ‘again’!
The post Best Bitcoin Trading Bot: User Review Guide appeared first on Master The Crypto.
Hong Kong is set to explore a general purpose central bank digital currency (CBDC) in an upcoming project tagged Project Aurum. This was disclosed by the Hong Kong Monetary Authority (HKMA) deputy chief Howard Lee.
Project Aurum
Lee said that CBDCs have been high on the Central bank’s agenda and believes CBDCs would potentially foster competition and innovation in the payment sector.
“The subject of CBDCs, be it wholesale or general-purpose, has been high on the agenda of the central banking community. Apart from being a new and trusted digital means of payment, CBDCs could potentially also foster competition and innovation in the payment sector.” Lee said.
The general purpose CBDC, according to Lee, would be distributed through commercial banks and payment service providers. This would allow the HKMA to study the benefits and challenges of different distribution architectures.
Project Aurum would explore the benefits and challenges of different architectures for the distribution of a general-purpose CBDC. The two architectural models under the project include the hybrid CBDC and private CBDC-backed stablecoin models.
A hybrid CBDC would allow intermediaries such as banks to handle payments while providing direct claims on the central bank. A CBDC-backed stablecoin, on the other hand, would minimize price volatility by pegging to a more stable asset such as fiat currency.
Asia Countries Racing To CBDC Mountain
Hong Kong and Thailand originally started research into cross-border CBDC payments last year. The project revolved around the two countries first, before other apex banks like China and the United Arab Emirates were brought onboard.
Last month, the Bank for International Settlements Innovation Hub in Hong Kong and the central banks announced their collaboration on a “Multiple CBDC Bridge” (m-CBDC Bridge) project to explore using distributed ledger technology to support real-time cross-border payment transactions on a 24/7 basis.
The project aimed to help central banks with cross-border fund transfers, international trade settlement, and capital market transactions. The idea is to alleviate regulatory, cost, and inefficiency pain points in cross-border fund transfers.
Unlike some countries that have been hesitant in developing a CBDC, Hong Kong has been proactive in building digital currency. Other Asian countries are ramping up CBDC development.
Japan recently announced that it would start its general purpose CBDC proof of concept this spring. South Korea just developed a pilot of a blockchain-based CBDC platform for retail use with conglomerate LG Corp.
China has also made tremendous progress in developing a CBDC. The country seems to be leading other countries in the race of creating a digital currency. In recent times, China has conducted mass trials of its digital yuan for retail use by the general public.
General Manager of Bank of International Settlements (BIS) Agustin Carstens has given his opinion on the role cryptocurrencies play in the economy.
According to Carstens, cryptocurrencies are mostly used to commit crimes and should be strictly regulated. Carstens, who aired his view in a CNBC show, said digital currencies were mostly used to execute arbitrage trades and contravene government regulations.
Crypto Is A Speculative Vehicle
To him, the growing use case of cryptocurrencies in criminal activities is worrying. He also mentioned that regulations against money laundering and terrorist financing were clearly missing in crypto applications.
Carstens’ views on cryptocurrencies are some of the reasons why several countries have refused to adopt virtual currencies wholesale.
Nations like China have outrightly banned private crypto ownership, instead opting for central bank digital currencies (CBDCs) controlled by the apex bank, the People’s Bank of China (PBoC). Chinese officials have even gone ahead to arrest residents who use cryptos to evade taxes.
India is another country that has taken a stand against Bitcoin, citing volatility as its reason. The Indian government is already looking to outlaw crypto-assets in the country in the latest crypto bill it will present to parliament this year.
However, Bitcoin and other cryptocurrencies have enjoyed a remarkable year so far. The crypto market hit a trillion-dollar valuation in Q1 2021, and major altcoins like Ethereum are quickly expanding their use cases. Investors are rapidly joining the crypto bandwagon as institutional demand has surged.
US Treasury Secretary Janet Yellen is a well-known critic of cryptocurrencies. Yellen, who has picked on Bitcoin severally, admonished the US government tocurtail cryptocurrencies given its propensity to be used for criminal activities. The Federal Reserve’s former chair also criticized digital assets for the highly volatile nature and noted that they were unfit to replace cash.
Crypto No Threat To Central Banks
Carstens said crypto’s high volatility qualifies it as a “speculative tool” and not a replacement for cash. According to the Mexican economist, this singular attribute makes it harmless to the well-established financial system.
Carstens also said that the dominance of cryptocurrencies (cyber currencies, as he calls them) had not been established as digital assets have not been able to usurp the exchange value of cash.
But despite the indifference legacy financial institutions have shown crypto, many industry experts see it as a “shaking up” of an already morbid financial climate. And the central banks are also taking notice.
In a published report that saw the likes of the Bank of England, the European Central Bank, and the US Federal Reserve participating, the BIS said that 20% of global apex banks are already initiating a CBDC program.
In its final notes, the report recommended that CBDCs serve a more secondary role to fiat and should be integrated into extant payment systems.
We use cookies on our website to give you the most relevant experience by remembering your preferences and repeat visits. By clicking “Accept”, you consent to the use of ALL the cookies.
This website uses cookies to improve your experience while you navigate through the website. Out of these, the cookies that are categorized as necessary are stored on your browser as they are essential for the working of basic functionalities of the website. We also use third-party cookies that help us analyze and understand how you use this website. These cookies will be stored in your browser only with your consent. You also have the option to opt-out of these cookies. But opting out of some of these cookies may affect your browsing experience.
Necessary cookies are absolutely essential for the website to function properly. These cookies ensure basic functionalities and security features of the website, anonymously.
Cookie
Duration
Description
cookielawinfo-checkbox-analytics
11 months
This cookie is set by GDPR Cookie Consent plugin. The cookie is used to store the user consent for the cookies in the category "Analytics".
cookielawinfo-checkbox-functional
11 months
The cookie is set by GDPR cookie consent to record the user consent for the cookies in the category "Functional".
cookielawinfo-checkbox-necessary
11 months
This cookie is set by GDPR Cookie Consent plugin. The cookies is used to store the user consent for the cookies in the category "Necessary".
cookielawinfo-checkbox-others
11 months
This cookie is set by GDPR Cookie Consent plugin. The cookie is used to store the user consent for the cookies in the category "Other.
cookielawinfo-checkbox-performance
11 months
This cookie is set by GDPR Cookie Consent plugin. The cookie is used to store the user consent for the cookies in the category "Performance".
viewed_cookie_policy
11 months
The cookie is set by the GDPR Cookie Consent plugin and is used to store whether or not user has consented to the use of cookies. It does not store any personal data.
Functional cookies help to perform certain functionalities like sharing the content of the website on social media platforms, collect feedbacks, and other third-party features.
Performance cookies are used to understand and analyze the key performance indexes of the website which helps in delivering a better user experience for the visitors.
Analytical cookies are used to understand how visitors interact with the website. These cookies help provide information on metrics the number of visitors, bounce rate, traffic source, etc.
Advertisement cookies are used to provide visitors with relevant ads and marketing campaigns. These cookies track visitors across websites and collect information to provide customized ads.


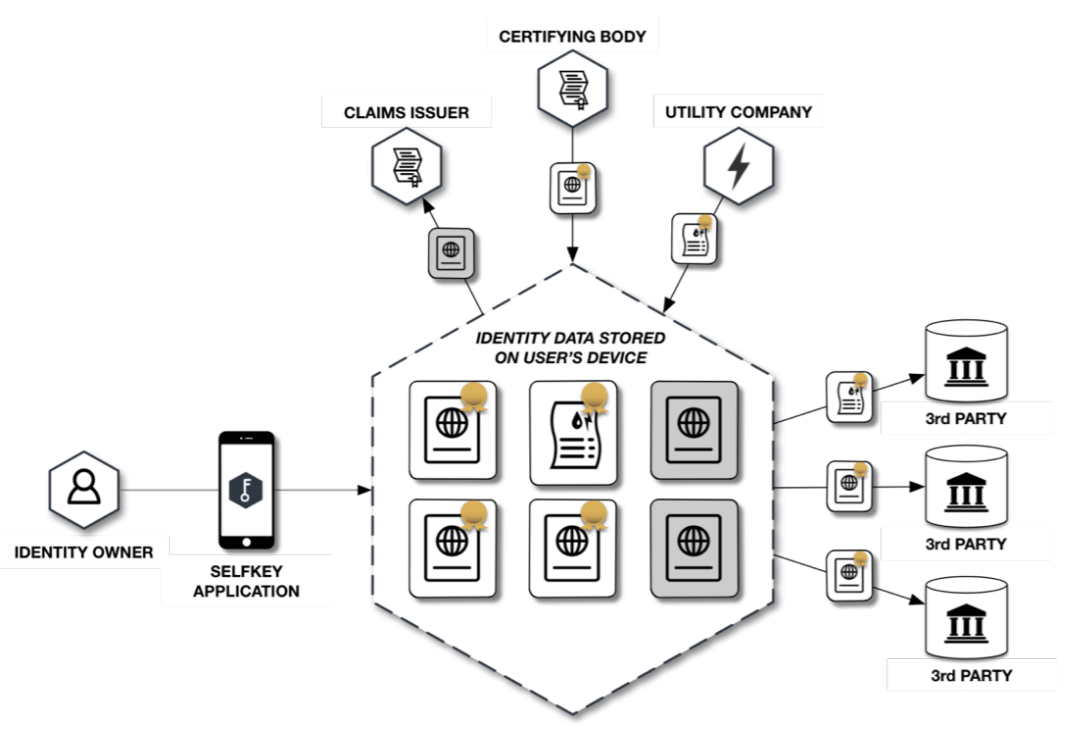


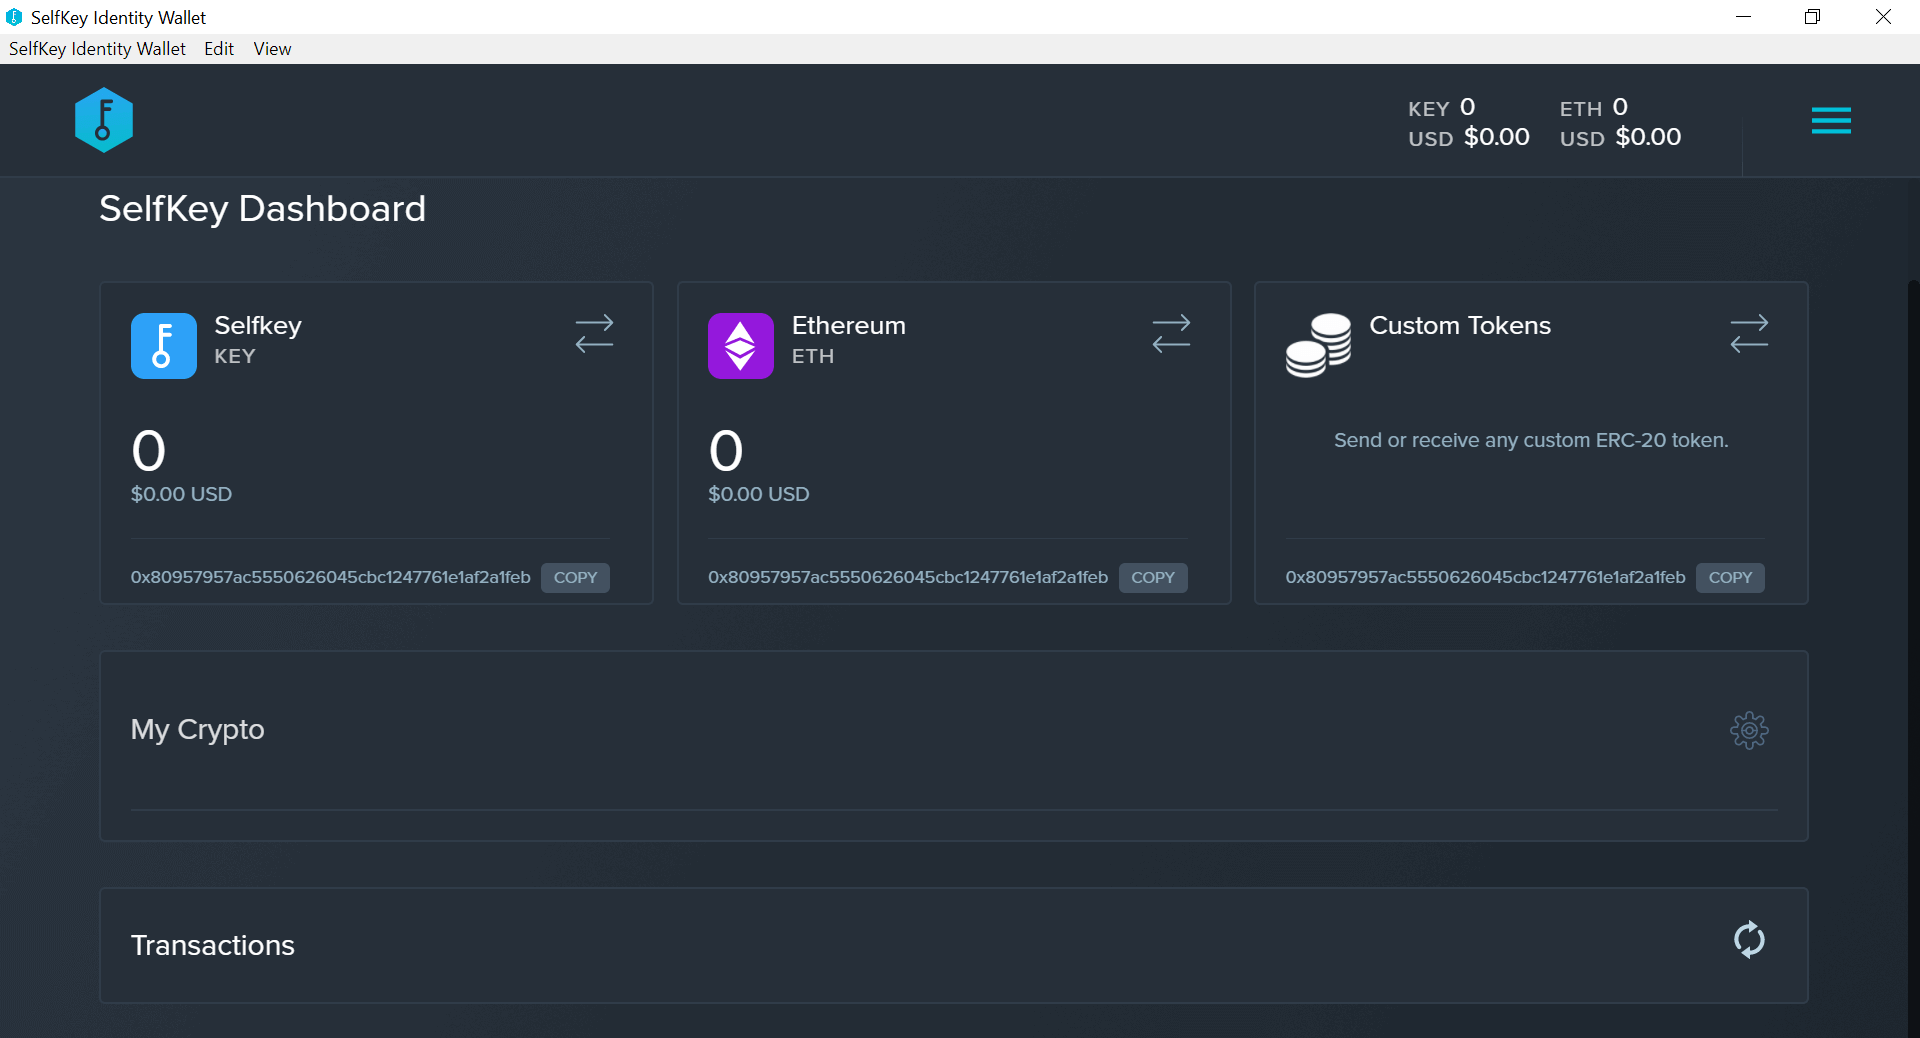

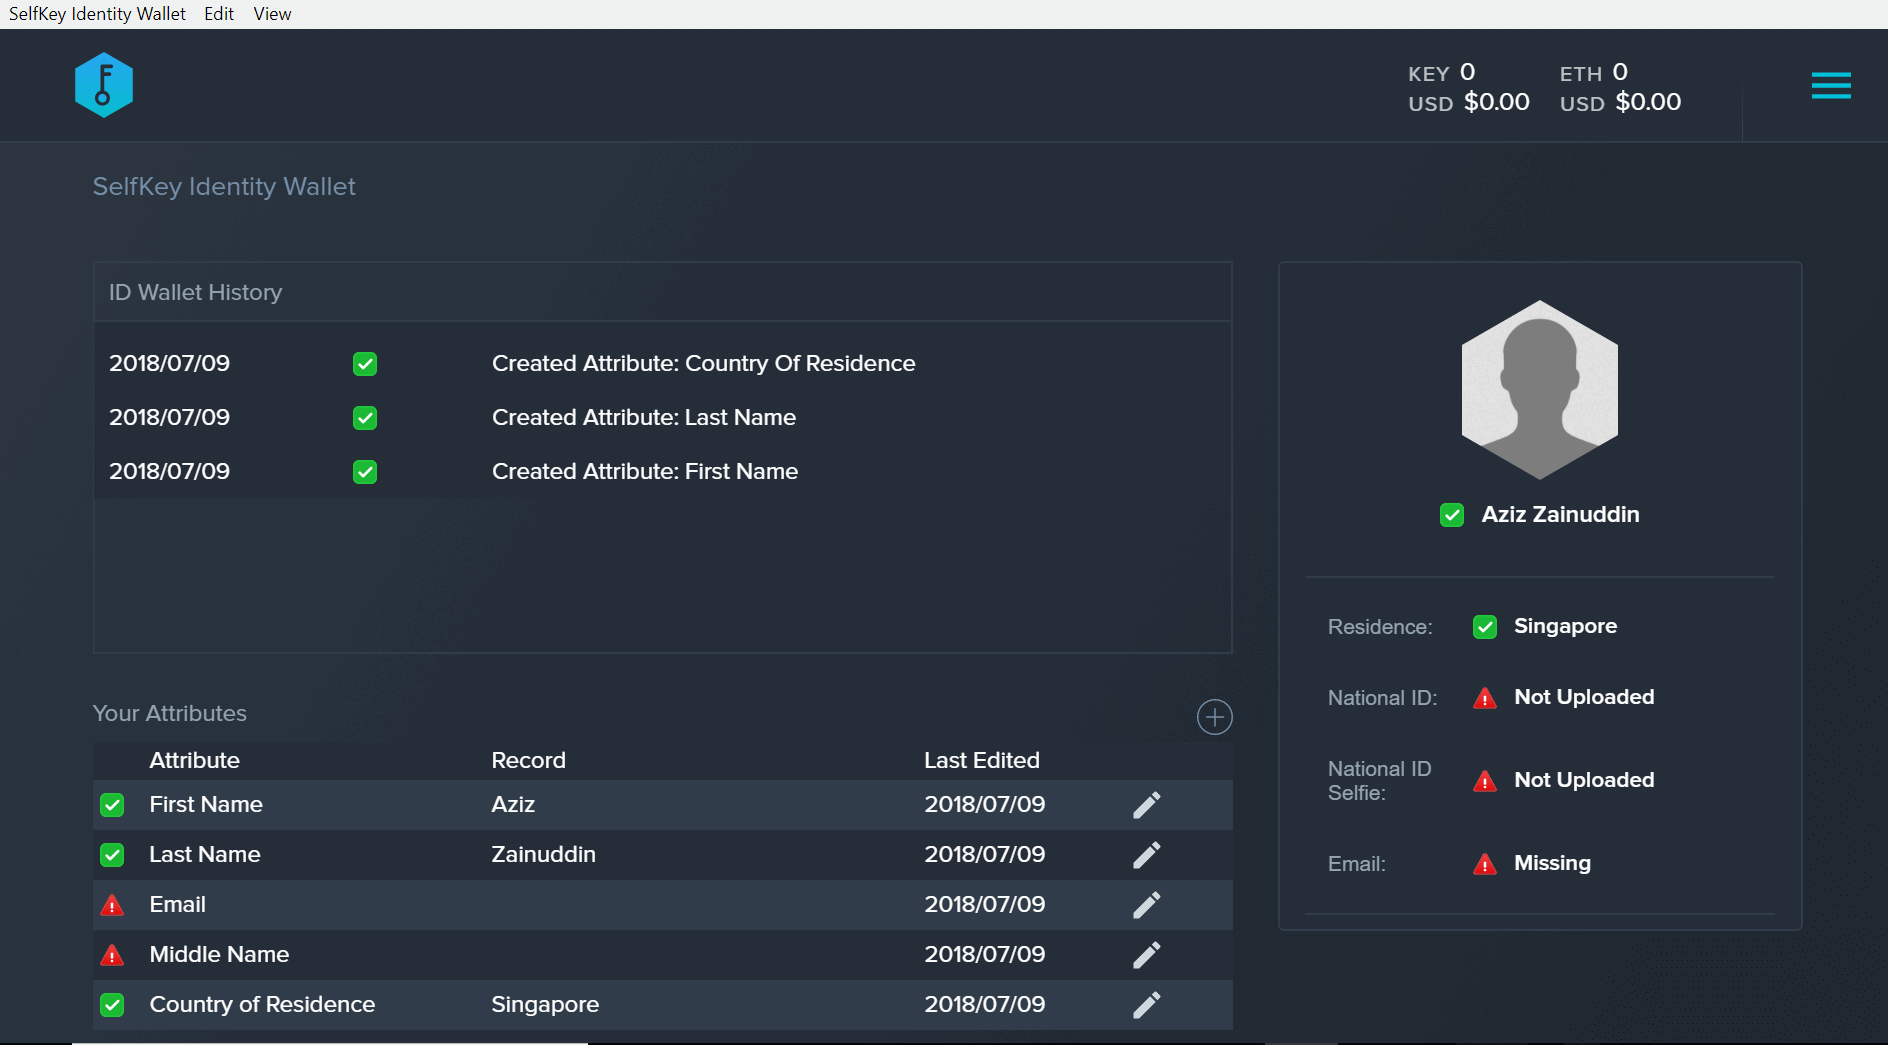

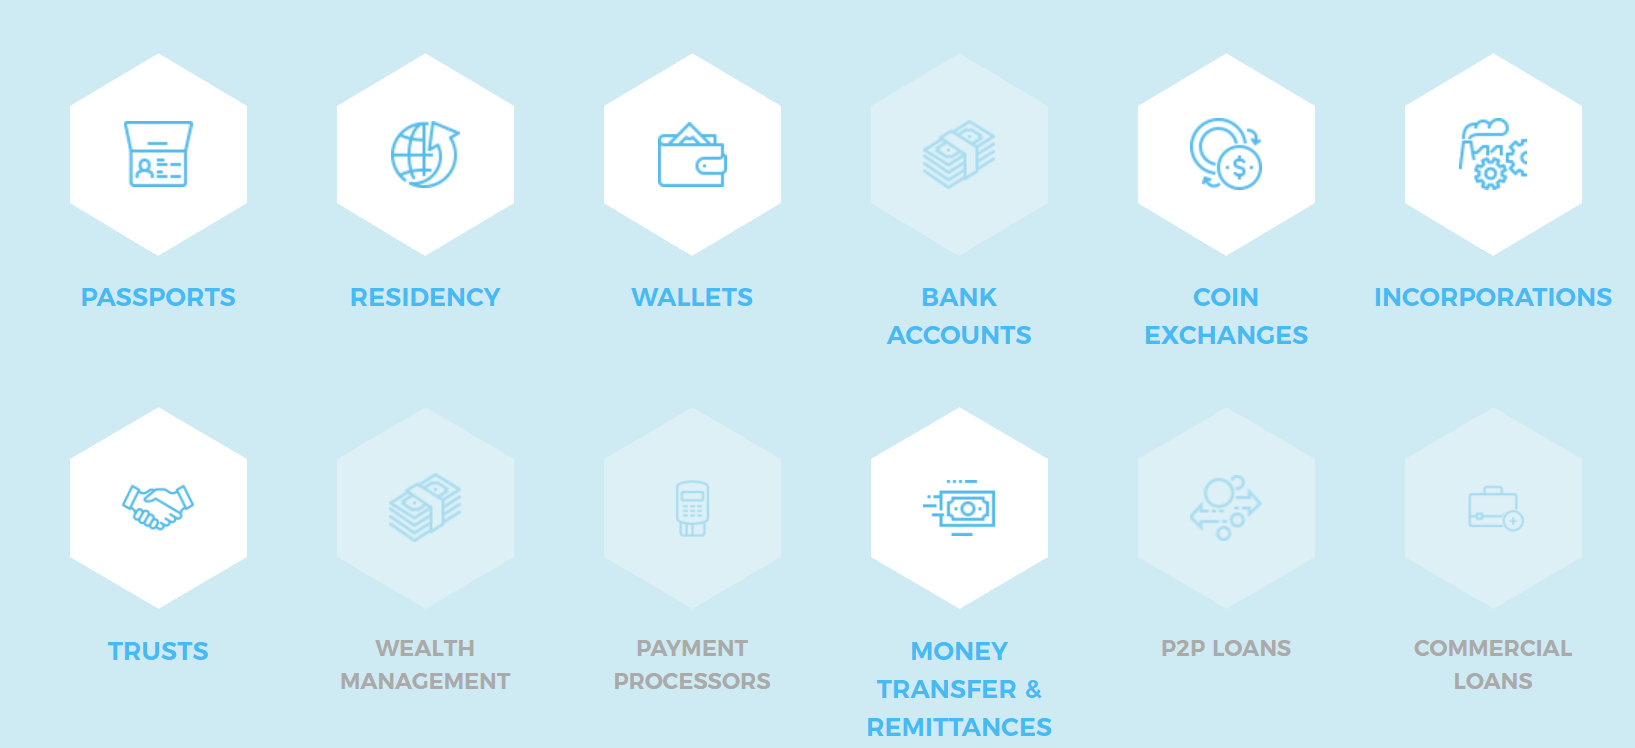


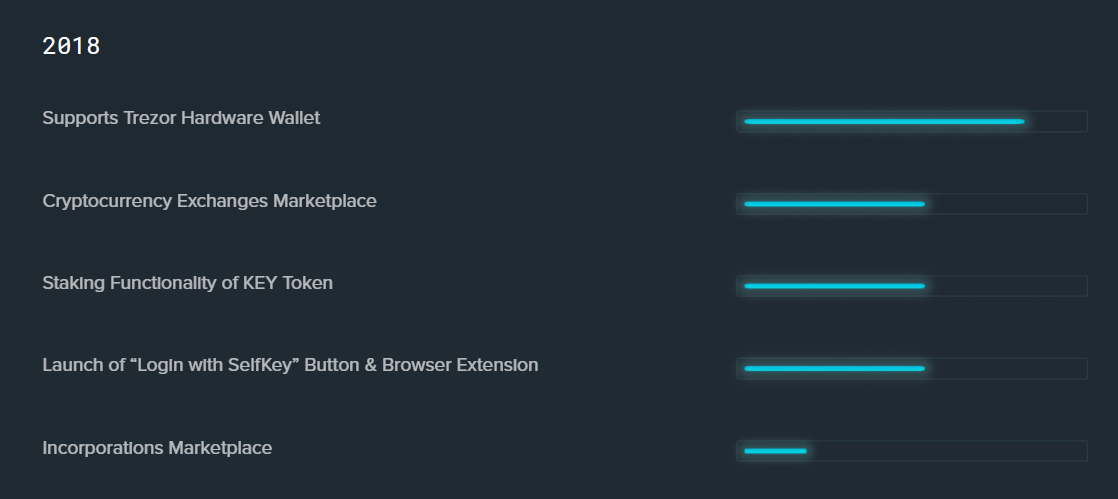
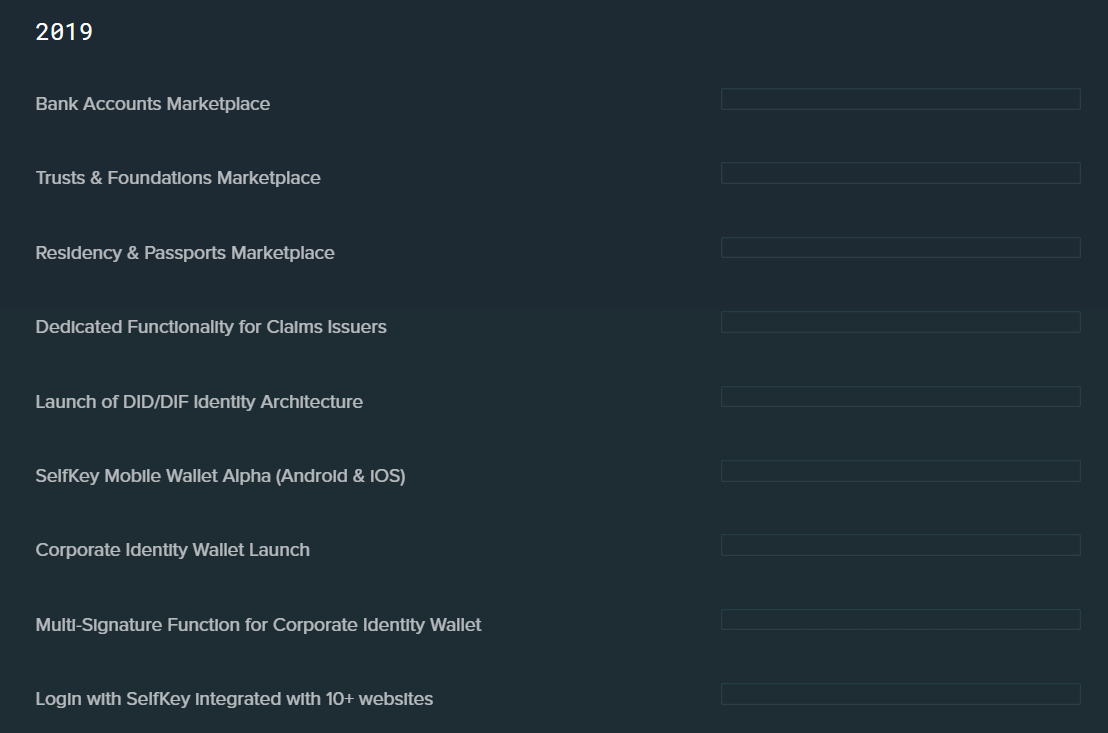


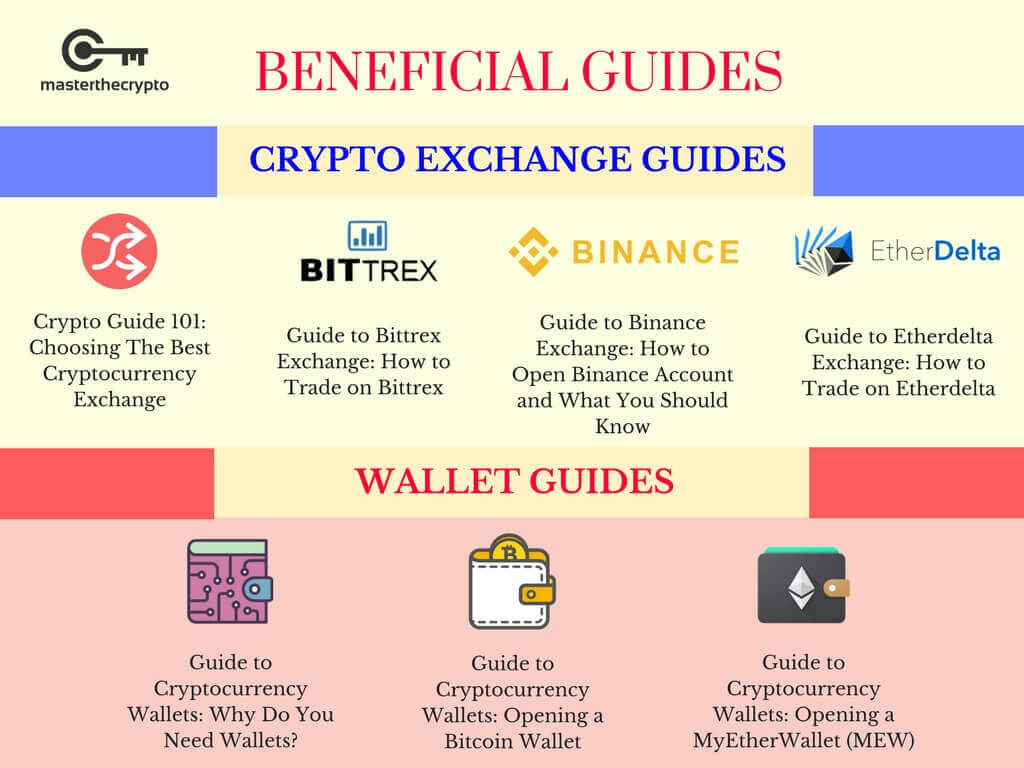


 Weekly Close 29")


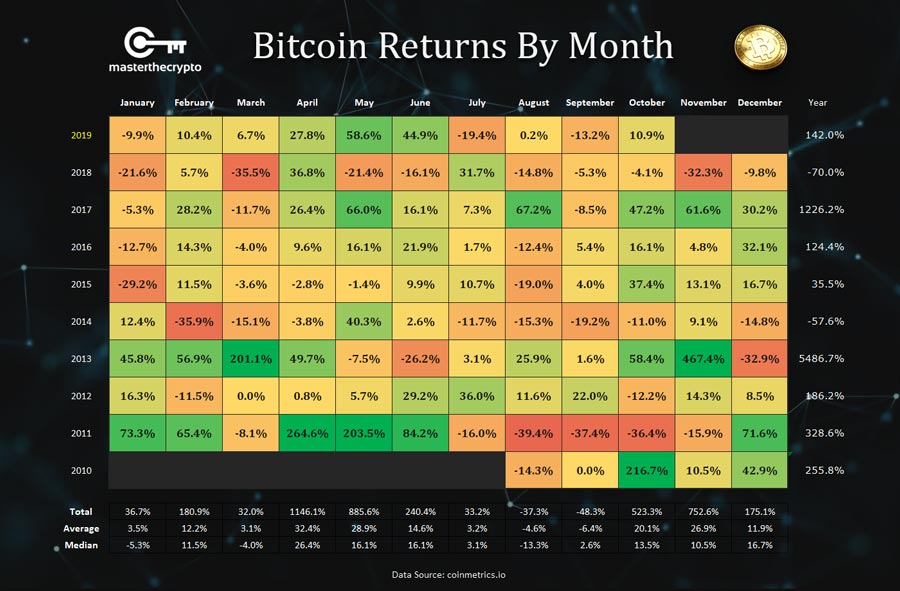


 Values in 2018")
 Values in 2017")
 Values in 2016")
 Values in 2015")
 Values in 2013")
 Values in 2012")
 Values in 2009-2011")