SHIB Price: Low Bearish Momentum, The sky Is the Beginning for TAMA
The bulls are dominating SHIB market
SHIBUSD Price Analysis – September 10
Further increase in the buyers’ momentum may break up $0.000013, $0.000014 resistance levels and the resistance level of $0.000015 may be tested. In case the sellers defend the resistance level of $0.000013, SHIB may reverse and penetrate $0.000012 downside, $0.000011 and $0.000010 may be reached.
Key levels:
Resistance levels: $0.000013, $0.000014, $0.000015
Support levels: $0.000012, $0.000011, $0.000010
SHIBUSD Long-term Trend: Bullish
On the daily chart, SHIBUSD is on the bullish movement. Since August 27, the crypto has being on a ranging mode. The scenario started when the sellers pushed the coin to the support level at $0.000012. The sellers’ momentum became weak and could not break down the level. The buyers’ pressure could not push the price above the resistance level of $0.00013. This is what led to ranging of the price within $0.000013 and $0.000012 levels.
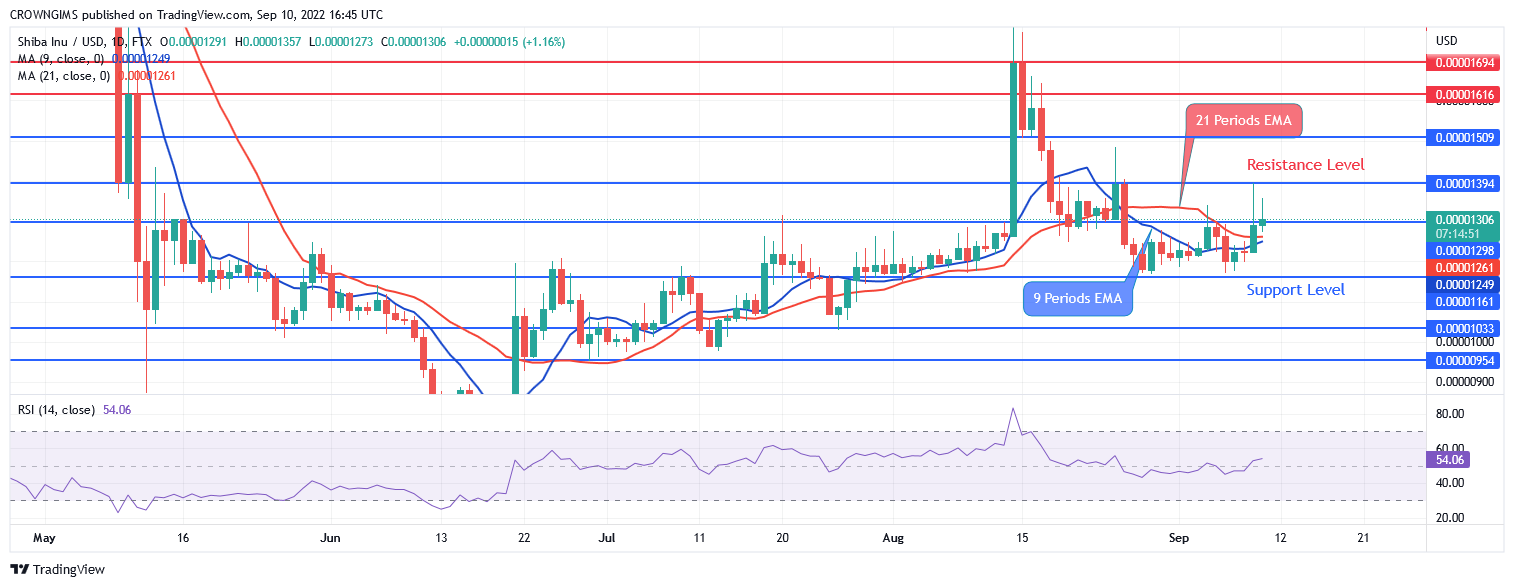
The fast Moving Average (9 periods EMA) is trying to cross the slow Moving Average (21 periods EMA) upside. The price is trading above the two EMAs as a sign of bullish movement. Further increase in the buyers’ momentum may break up $0.000013, $0.000014 resistance levels and the resistance level of $0.000015 may be tested. In case the sellers defend the resistance level of $0.000013, price may reverse and penetrate $0.000012 downside, $0.000011 and $0.000010 may be reached. However, the relative strength index period 14 is at 54 levels pointing upside to indicate buy signal.
SHIBUSD medium-term Trend: Bullish, The sky Is the Beginning for TAMA
SHIBUSD is bullish in the 4-hour chart. The coin falls from the resistance level of $0.000017 to the support level of $0.000012. It consolidates for few days before buyers gained enough pressure which break up the $0.000013. The price is increasing towards the resistance level of $0.000013.
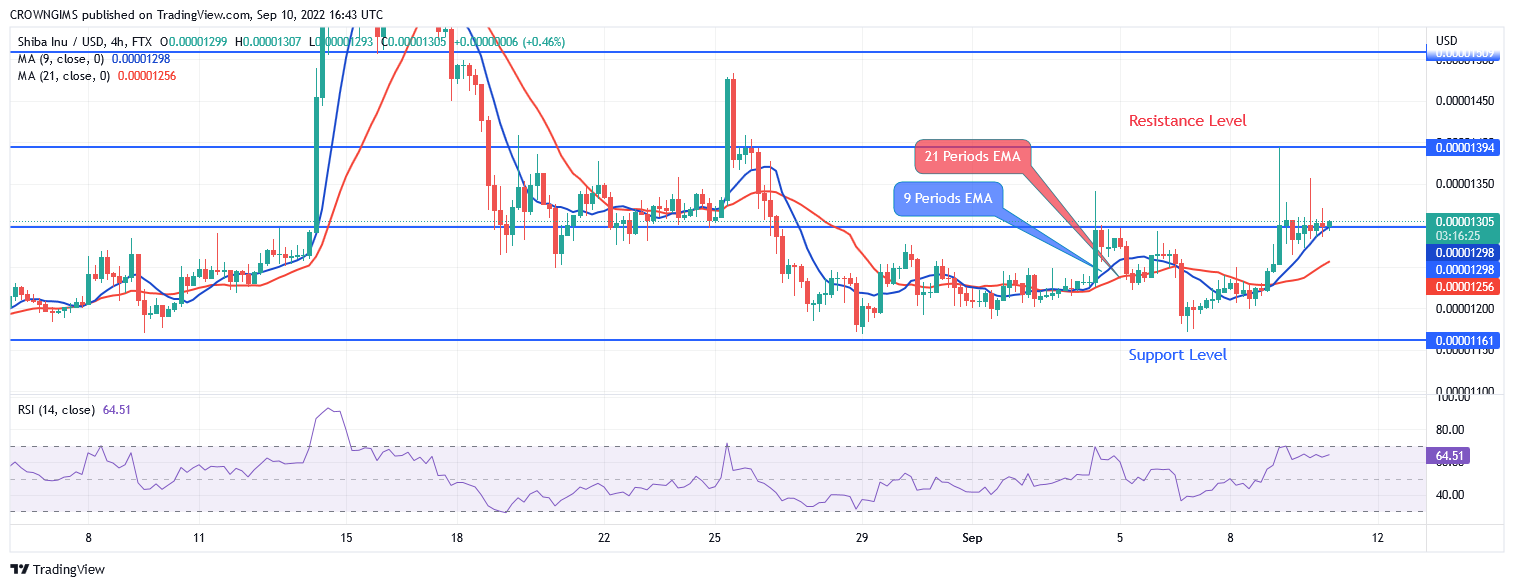
The coin is trading above the 21 periods EMA and 9 periods EMA. The two EMAs are separated from each other which indicates a bullish momentum in Shiba Inu market. The relative strength index period 14 is at 64 levels and the signal lines is exhibiting buy signal.